 Live
Live
SBIN Weekly Outlook and Analysis:
For the Week: (April 26,2021 – April 30,2021)
BSE: 500112| NSE: SBIN| ISIN: INE062A01020| SECTOR: BANKS
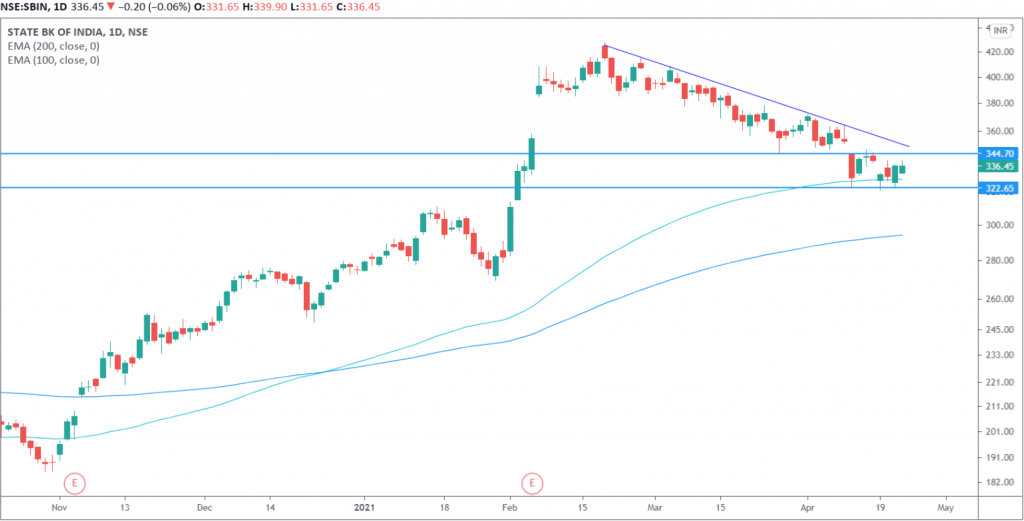
State Bank Of India Share Price : 336.45 (NSE)
SBI closed the Weekly on Negative Note Losing 1.02%
Weekly High: 339.90
Weekly Low: 321.30
Weekly Range: 18.60 points
Weekly Support & Resistance For SBIN:
| RESISTANCE 2 | 350 |
| RESISTANCE 1 | 343 |
| SUPPORT 1 | 325 |
| SUPPORT 2 | 314 |
Technically on the daily charts EquityPandit’s Analyst see: Minor support on the downside lies at 325 levels, Minor resistance on the upside is capped around 343 levels.
If stock breaches minor support on the downside and closes below it we may see fresh break down and stock can drag towards Major Support on lower side @314 and If stock breaches minor resistance on the upside and closes above it we may see fresh breakout and stock can head towards Major Resistances Level @ 350.
Stock is trading above 200 days exponential moving average, suggests long term trend is bullish. EquityPandit’s Predicts Range for the Weekly as 350 on upside and 314 on downside.
On the daily chart we can see that stock is moving in range of 348-321 . Past two trading sessions was bullish for the stock. Positive bias was made with the help of 100 EMA. Only break above 348 level will take price higher towards 370.
