 Live
Live
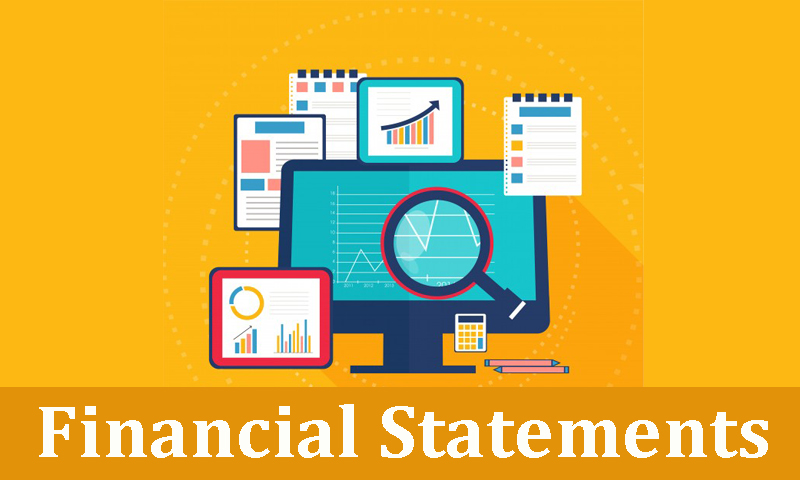
Financial statements serve as the bedrock for evaluating a company’s fiscal health and performance. For investors, business owners, and financial professionals alike, the ability to interpret these documents is an invaluable skill. This comprehensive guide will walk you through the intricacies of financial statements, empowering you to make informed decisions and gain deeper insights into a company’s financial position.
Though the financial statements provide an objective overview of a corporation’s economic activities, they can convey important information about the profitability, liquidity, and general financial stamina of a company. If one knows how to read and interpret these reports well, one can have greater power in critically evaluating investment opportunities, observing business performance, and making strategic financial decisions.
This guide is designed to highlight and untangle the components of the major financial statements as well as share useful tips for their analysis, either for the seasoned investor or the nascent entrepreneur. By using this resource, you can find your way into the opaque world of financial statements.
The Fundamental Financial Statements
At the core of financial reporting lie three primary statements that collectively paint a comprehensive picture of a company’s financial health:
- The Balance Sheet
- The Income Statement
- The Cash Flow Statement
Each of these documents offers unique insights into different aspects of a company’s financial position and performance. Let’s delve into each one to understand their purpose and structure.
The Balance Sheet
The balance sheet offers a snapshot of a company’s financial position at a specific point in time, detailing its assets, liabilities, and shareholders’ equity in accordance with the fundamental accounting equation: Assets = Liabilities + Shareholders’ Equity. Typically prepared at the end of a reporting period, such as a quarter or fiscal year, the balance sheet helps assess a company’s liquidity (ability to meet short-term obligations), solvency (capacity to fulfil long-term debts), and capital structure (the mix of debt and equity used for financing).
Key components include assets—categorised into current (e.g., cash, accounts receivable, inventory), non-current (e.g., property, plant, and equipment), and intangible assets (e.g., patents, goodwill). Liabilities are divided into current (e.g., accounts payable, short-term debt) and non-current (e.g., long-term debt, deferred taxes).
Comparing current assets and current liabilities on the balance sheet is necessary in determining liquidity. This can also include a review of the debt-to-equity ratio to determine leverage. Furthermore, the trend analysis of assets versus liabilities will point out how this company is expanding over time. Finally, looking at the balance sheet and making judgments on quality, accounts receivable and inventory are crucial sources where risks or inefficiencies might lurk.
The Income Statement
Also known as the profit and loss statement, the income statement reveals a company’s financial performance over a specific period. It outlines revenues, expenses, and the resulting profit or loss. Key elements of the income statement include:
- Revenue: The total amount earned from sales or services
- Cost of Goods Sold (COGS): Direct costs associated with producing goods or services
- Gross Profit: Revenue minus COGS
- Operating Expenses: Costs incurred in running the business (e.g., salaries, rent, marketing)
- Operating Income: Gross profit minus operating expenses
- Net Income: The bottom line after accounting for all revenues, expenses, taxes, and interest
When analysing an income statement, consider these factors:
- Revenue growth trends over multiple periods
- Gross profit margin and its stability over time
- Operating expenses as a percentage of revenue
- Net profit margin and its comparison to industry benchmarks
The Cash Flow Statement
The cash flow statement provides a detailed overview of the movement of cash in and out of business over a specific period, offering valuable insights into its financial health. Divided into three sections, it covers operating activities (cash generated or used in core business operations), investing activities (cash flows related to acquiring or disposing of long-term assets), and financing activities (cash flows from raising capital or repaying debts).
Key takeaways are the company’s ability to generate positive cash flow from operations, the impact of capital expenditure on cash reserves, reliance on external financing, and whether the company is sustainable enough to pay dividends or buy back shares.
While analysing, emphasis should be laid on consistency between net income and operating cash flow, the quality of earnings, the ability to fund growth through internal cash generation, and discrepancies between accrual-based earnings and cash flow. This statement is critical in the assessment of the liquidity and operational efficiency of a company, as well as its financial strategy.
Additional Financial Statements
While the balance sheet, income statement, and cash flow statement form the core of financial reporting, there are additional statements that provide valuable insights:
Statement of Changes in Equity
This document tracks changes in shareholders’ equity over a reporting period. It includes:
- Opening balance of equity
- Net income or loss for the period
- Dividends paid
- Issuance or repurchase of shares
- Other comprehensive income or loss
Analysing this statement helps you understand how a company’s equity position has evolved and the impact of various transactions on shareholder value.
Statement of Comprehensive Income
This statement expands on the traditional income statement by including items that affect a company’s equity but are not reported in the income statement. These might include:
- Foreign currency translation adjustments
- Unrealised gains or losses on available-for-sale securities
- Changes in pension liabilities
By examining comprehensive income, you gain a more complete picture of a company’s financial performance beyond just net income.
Key Financial Ratios and Metrics
Financial ratios provide a standardised way to compare companies and assess their financial health. Here are some essential ratios to consider when analysing financial statements:
Liquidity Ratios
- Current Ratio = Current Assets / Current Liabilities
- Quick Ratio = (Current Assets – Inventory) / Current Liabilities
These ratios measure a company’s ability to meet short-term obligations.
Profitability Ratios
- Gross Profit Margin = (Revenue – COGS) / Revenue
- Net Profit Margin = Net Income / Revenue
- Return on Equity (ROE) = Net Income / Shareholders’ Equity
Profitability ratios assess a company’s ability to generate earnings relative to its revenue, assets, or equity.
Efficiency Ratios
- Inventory Turnover = COGS / Average Inventory
- Accounts Receivable Turnover = Revenue / Average Accounts Receivable
These ratios measure how effectively a company utilises its assets.
Leverage Ratios
- Debt-to-Equity Ratio = Total Liabilities / Shareholders’ Equity
- Interest Coverage Ratio = EBIT / Interest Expense
Leverage ratios assess a company’s financial risk and its ability to meet debt obligations.
The Role of Financial Statements in Investment Decision-Making
Financial statements are very important for investors in making their decisions. Here’s how to use them effectively:
- Fundamental Analysis: Use financial statements to assess a company’s intrinsic value and growth potential.
- Trend Analysis: Analyse financial statements over several periods to identify trends and trends.
- Comparative Analysis: This would benchmark a company’s financial performance against its peers and industry standards.
- Risk Assessment: Review financial statements to determine the stability of a company’s financials and the associated risks.
- Valuation: Calculate key valuation metrics such as P/E ratio or enterprise value to EBITDA using financial statement data.
Conclusion
Mastering the art of reading financial statements is an invaluable skill for investors, business owners, and financial professionals. By understanding the structure and purpose of each statement, leveraging key ratios and metrics, and avoiding common pitfalls, you can gain deep insights into a company’s financial health and make more informed decisions.
Keep in mind that merely having a look at financial statements provides only an incomplete picture of the company. To genuinely understand a company’s resale value distinctly as a going concern, combine analysis through industry knowledge, management insight, and broad economic factors. By continually improving your skills in financial statement analysis, you will be better positioned to navigate effectively within the world of finance in order to arrive at valid investment and business decisions.
The future of investing is here!
Unicorn Signals leverages advanced AI technology to provide you with powerful market predictions and actionable stock scans. Download the app todayand 10x your trading & investing journey!
