 Live

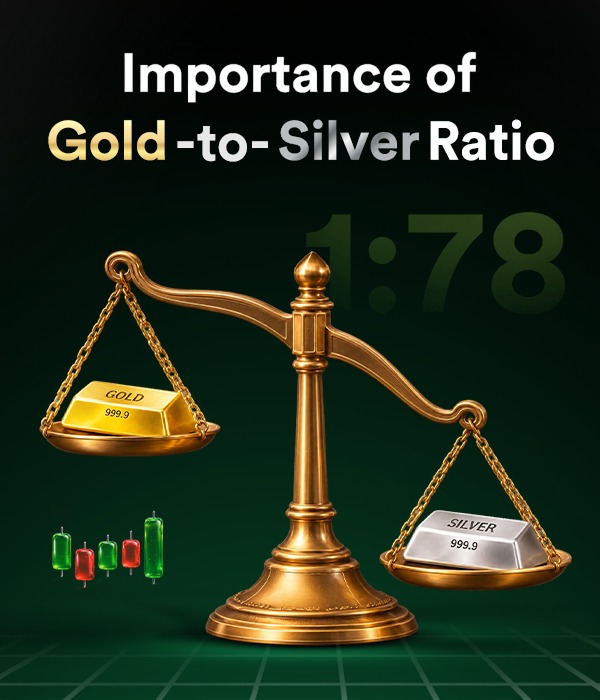
Precious metals have seen an extraordinary cycle in India over the last two years. In 2025, gold surged 78% on the Multi Commodity Exchange (MCX), while silver rallied 144%. In 2026, both gold and silver touched record highs before seeing sharp swings. By November 2026, 24-karat gold in the Indian spot and futures market was trading around ₹1,40,000 per 10 grams, while 999 fine silver was hovering around ₹1,80,000 per kilogram.
Indian households are participating in this precious metals cycle like never before, not only during festive buying windows like Dhanteras, but increasingly through demat and digital instruments. However, when deciding whether to put fresh money into gold or silver today, most retail investors look at the Gold-to-Silver Ratio. In this blog post, we will explore the Gold-to-Silver Ratio in detail.
What is the Gold-to-Silver ratio?
The Gold-to-Silver Ratio is a relative valuation metric that shows how many grams (or kilograms) of silver are required to buy a gram (or kilogram) of 24-karat gold at current market prices. It doesn’t tell you if gold or silver is cheap in rupee terms; it tells you how much one metal is worth compared to the other:
Gold-to-Silver Ratio = Gold Price/ Silver Price
For example, if 1 kilogram of gold costs ₹1,40,00,000 and 1 kilogram of silver costs ₹1,80,000, the ratio is approximately 78:1. This means 1 gram of gold can buy 78 grams of silver in the domestic market.
How to avoid the unit mismatch in Indian quotes
In global markets, both gold and silver rates are quoted in US dollars per troy ounce, so investors can simply divide one by the other to obtain the Gold-to-Silver Ratio. But in India, there is a standard difference in their units, which confuses retail buyers, as domestic gold is quoted per 10 grams while silver is quoted per 1 kilogram (1,000 grams).
To calculate the Gold-to-Silver Ratio accurately, market participants need to always bring both metals to the same weight category first:
- Check the price of 24K (999) gold per 10 grams: Suppose the gold is trading at ₹1,40,000 per 10 grams.
- Convert the gold price to a 1-gram price: Divide the 10-gram gold price by 10 to get the gold price per gram (₹14,000 per gram).
- Divide by the matching weight of silver: Divide the 1-gram gold price (₹14,000) by the 1-gram silver price (₹180).
- The result: The domestic Gold-to-Silver Ratio is 77.8:1 (around 78:1).
What causes change in the Gold-to-Silver Ratio?
Several factors influence gold and silver prices and, eventually, the Gold-to-Silver Ratio. Some of those are mentioned below:
Gold is a safe-haven and central bank asset
Gold primarily serves as a store of household wealth, a monetary reserve asset and a hedge against rupee depreciation. According to the World Gold Council’s (WGC) Gold Demand Trends report for Q3 2026, gold demand in India in the July-September 2026 period was 162.5 tonnes, valued at ₹2,41,900 crore and grew by 3% in value terms on a y-o-y basis and is expected to be around 625 – 675 tonnes for the full year 2026.
Moreover, the central banks around the world added 321 tonnes of gold in Q3 2026 alone, a 42% increase from the previous quarter, and the Reserve Bank of India (RBI) has 880.51 tonnes of gold in its foreign exchange reserves as of Q3 2026.
Silver plays a dual role
Besides being a precious metal, Silver also remains one of the crucial industrial raw materials. As reported by the Silver Institute (World Silver Survey 2026), industrial fabrication represents about 58% of total global silver demand (about 657 million ounces/year).
In addition, silver consumption in India has experienced high growth this year, supported by the government’s aggressive renewable energy targets, the introduction of the PM Surya Ghar: Muft Bijli Yojana and booming production of EVs and electronics in the country, given silver’s high electrical conductivity.
Meanwhile, silver supply is projected to run a sixth consecutive annual deficit in 2026 (46.3 million ounces), as more than 70% of mined silver is a byproduct of copper, lead, and zinc mining and cannot be increased quickly.
Market size and volatility
According to World Gold Council data, the global gold market is about eight times larger in market value than the silver market, and its traded volume per day is almost six times that of silver.
Since the silver market is relatively smaller and associated with manufacturing cycles, the same influx of buying or selling pressure moves silver prices nearly twice as sharply as gold rates.
How to interpret the Gold-to-Silver Ratio
The Gold-to-Silver Ratio has been highly volatile for Indian investors in 2026. Its movements matter to market participants because this ratio helps them assess whether gold or silver has become relatively expensive at a given point in time or not. However, it should be read as a standalone indicator. Here is how investors can interpret each zone before deploying capital:
When the ratio is high (e.g., above 80 )
Gold has become significantly more expensive relative to silver, or silver has been sold off heavily. This makes silver undervalued relative to gold. In precious metal bull markets, silver tends to exhibit higher volatility. A high ratio often signals an opportunity to allocate more capital toward silver or silver ETFs, anticipating that silver will eventually catch up.
When the ratio is in the neutral zone (60 to 80)
Within the 60-80 range, the ratio does not give a strong directional signal for one metal over the other. Investors in this zone often prefer to rebalance their precious metal portfolio or focus on broader asset-allocation objectives, like how much precious-metals exposure they want overall, rather than trying to pick between the two metals based on relative value alone.
When the ratio is low (e.g., below 50)
It signals that silver has outperformed gold due to speculative rallies or sudden increases in industrial demand. This causes the price of gold to be undervalued against silver. At these levels, gold is often a popular investment choice for investors looking to preserve their capital.
How can Indian investors use it?
The Gold-to-Silver ratio should not be used by Indian investors in isolation. Buyers can go through the below-mentioned process before buying gold and silver instruments:
- Check the current ratio: Convert gold and silver prices into the same weight unit and calculate the ratio.
- Compare with historical ranges: See whether the current ratio is high, low or near its long-term average.
- Understand the reason: Identify whether the move is driven by gold, silver, currency, industrial demand or global risk sentiment.
- Match it with your goal: A long-term investor may prioritise stability, while a tactical investor may focus on relative value.
- Avoid overallocation: Precious metals should complement a portfolio, not dominate it.
For example, if the ratio is unusually high and silver’s industrial-demand outlook is improving, an investor may consider a measured silver allocation. But if silver has already rallied sharply and the ratio has compressed, chasing it after a large move may carry higher correction risk.
Common pitfalls to avoid
Despite the Gold-to-Silver ratio’s strength as an analytical tool, one must watch out for these pitfalls while working with the Gold-to-Silver Ratio:
- Expecting immediate mean reversion: The ratio can stay at extreme levels (either very high or very low) for months or even years. Thus, traders should not use the ratio to place aggressive short-term leveraged bets.
- Ignoring the global macro environment: A high Gold-to-Silver ratio during a deep global recession may not lead to an immediate silver rally, because industrial demand for silver could remain depressed even if the ratio looks attractive.
- Ignoring storage and liquidity costs: When buying physical bullion instead of ETFs, remember that physical buying attracts marking charges, GST, and a 2%–5% spread.
- Ignoring Expense Ratios (TER) and tracking error: Before investing in an ETF or FoF SIP, compare the scheme’s Total Expense Ratio (TER), daily trading volume, and tracking error so your returns closely align with domestic bullion prices.
- Going “all-in” on silver investments when the ratio is above 80:1: Even when silver prices look cheap relative to gold, it carries equity-like volatility. A high ratio may indicate relative value, but it does not guarantee an immediate rally.
The bottom line
The gold-to-silver ratio is a simple but useful metric for investors looking to make an investment in either of the two metals. It shows whether gold or silver is relatively expensive at a given point in time and helps investors avoid making buying decisions solely on recent performance.
In 2026, the gold-to-silver ratio moved through a wide range from around 85:1 in late February to 64:1 in June and near 78:1 in November 2026. But the ratio alone should never trigger a trade. Investors should also assess industrial demand, global risk sentiment, currency movements, supply conditions and their own investment horizon before making an investment decision.
For Indian investors, the best approach is to check the ratio, understand what is driving it, compare domestic MCX prices and then decide whether gold, silver or a mix of both aligns with their overall investment plan.