 Live
Live
ITC Outlook Weekly and Analysis:
For the Week: (April 12,2021 – April 16,2021)
BSE: 500857| NSE: ITC| ISIN: INE154A01025 | SECTOR: FMCG
ITC Share Price: 213.10 (NSE)
ITC closed the Week on Negative Note Losing 3.16%
Weekly High: 220.00
Weekly Low: 210.15
Weekly Range: 09.85 points
Weekly Support & Resistance for ITC Limited:
| RESISTANCE 2 | 224 |
| RESISTANCE 1 | 218 |
| SUPPORT 1 | 208 |
| SUPPORT 2 | 204 |
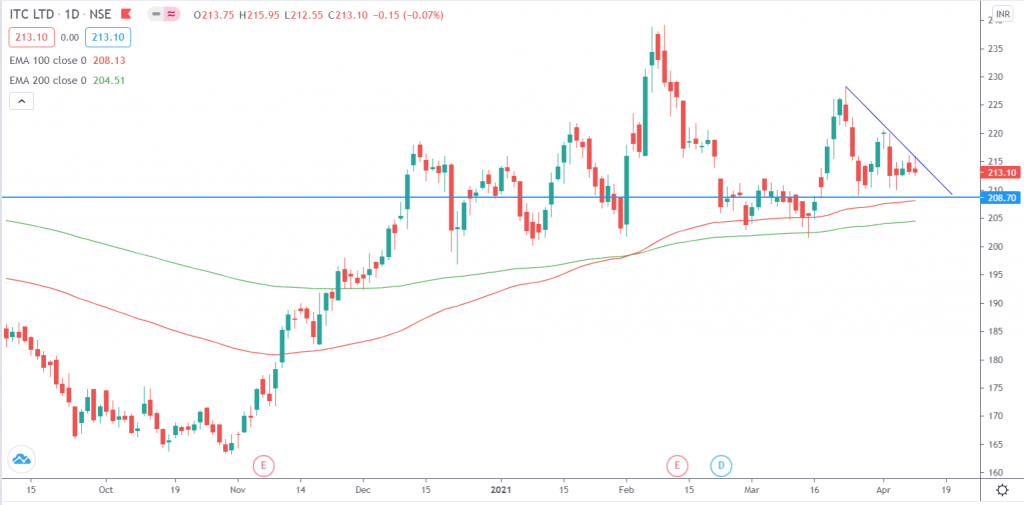
Technically on the daily charts EquityPandit’s Analyst see: Minor support on the downside lies at 208 Levels, Minor resistance on the upside is capped around 218 levels.
If stock breaches minor support on the downside and closes below it we may see fresh break down and stock can drag towards Major Support on lower side @ 204 and If stock breaches minor resistance on the upside and closes above it we may see fresh breakout and stock can head towards Major Resistances Level @ 224
Stock is trading above 200 days exponential moving average, suggests long term trend is bullish. EquityPandit predicts range for the Weekly as 224 on upside and 204 on downside.
The trend for ITC LTD. seems to be sideways to positive. Break above 216 levels will take prices higher towards 225 levels as long as 208 –209 levels stays protected on lower side.