 Live
Live
Check Axis Bank Full Analysis at Unicorn Signals
Axis Bank Weekly Outlook and Analysis:
For the Week: (05-JUN-2023 to 09-JUN-2023)
BSE: 532215| NSE: AXISBANK| ISIN: INE238A01034| SECTOR: BANKS
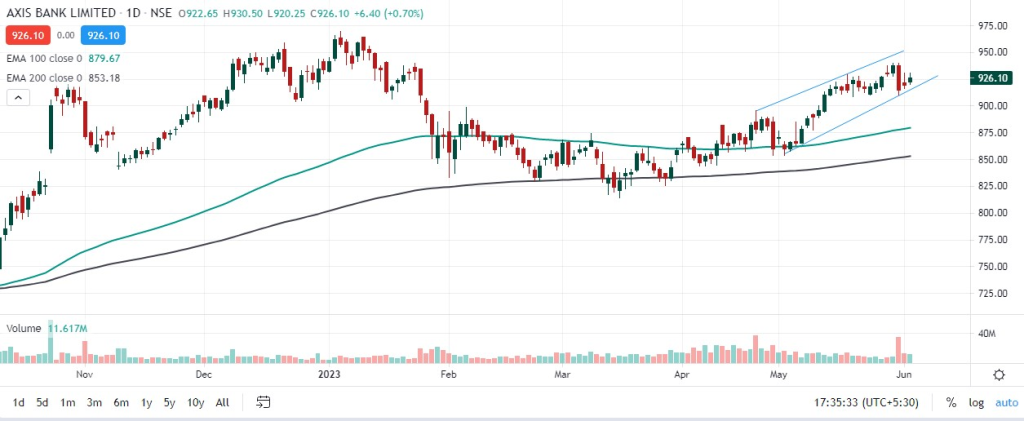
AXIS Bank Share Price: 926.10 (NSE)
AXIS Bank closed the Weekly on Negative Note losing 0.09%
Weekly High: 939.90
Weekly Low: 910.20
Weekly Range: 29.70 Points
Weekly Support & Resistance For Axis Bank:
| RESISTANCE 2 | 955 |
| RESISTANCE 1 | 941 |
| SUPPORT 1 | 911 |
| SUPPORT 2 | 896 |
Technically on the daily charts EquityPandit’s Analyst see: Minor support on the downside lies at 911 levels, Minor resistance on the upside is capped around 941 levels.
If stock breaches minor support on the downside and closes below it we may see fresh break down and stock can drag towards Major Support on lower side @ 896 and If stock breaches minor resistance on the upside and closes above it we may see fresh breakout and stock can head towards Major Resistances Level @ 955
Stock is trading above 200 days exponential moving average, suggests long term trend is bullish. EquityPandit’s Predicts Range for the Weekly as 955 on upside and 896 on downside.
