 Live
Live
AXISBANK Weekly Outlook and Analysis:
For the Week: (June 05, 2021 – June 11, 2021)
BSE: 532215| NSE: AXISBANK| ISIN: INE238A01034| SECTOR: BANKS
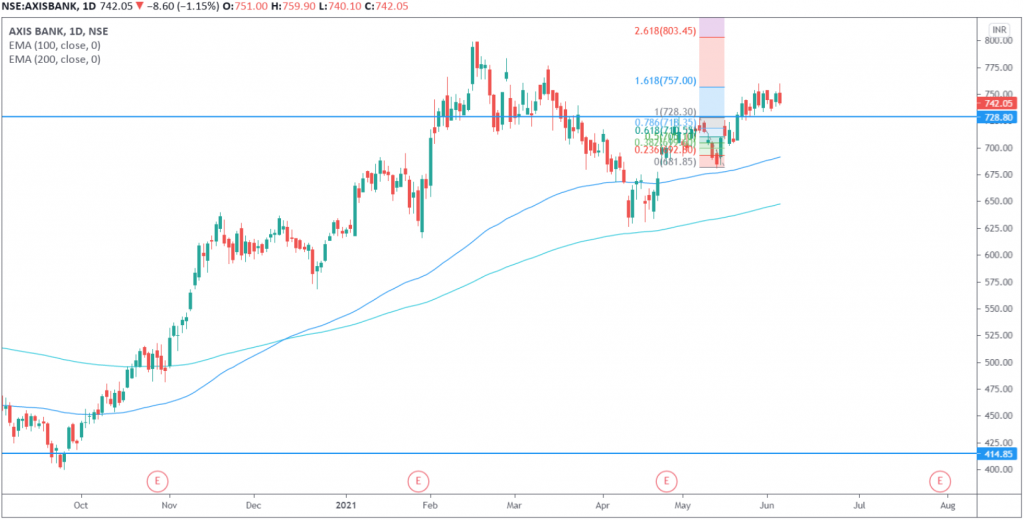
AXISBank Share Price: 742.05 (NSE)
AXISBank closed the Weekly on Positive Note Gaining 0.30%
Weekly High: 759.90
Weekly Low: 734
Weekly Range: 25.90 Points
Weekly Support & Resistance For Axis Bank:
| RESISTANCE 2 | 771 |
| RESISTANCE 1 | 756 |
| SUPPORT 1 | 730 |
| SUPPORT 2 | 719 |
Technically on the daily charts EquityPandit’s Analyst see: Minor support on the downside lies at 730 levels, Minor resistance on the upside is capped around 756 levels.
If stock breaches minor support on the downside and closes below it we may see fresh break down and stock can drag towards Major Support on lower side @ 719 and If stock breaches minor resistance on the upside and closes above it we may see fresh breakout and stock can head towards Major Resistances Level @771
Stock is trading above 200 days exponential moving average, suggests long term trend is bullish. EquityPandit’s Predicts Range for the Weekly as 771 on upside and 719 on downside.
The present structure shows that AXIS BANK share price are manage to close above trend line. For the near term, the zone of 728-730 has now become a temporary support for the stock.
Stock is trading below 200 days exponential moving average, suggests long term trend is bearish. EquityPandit’s Predicts Range for the Weekly as 460 on upside and 407 on downside.
