 Live
Live
AXISBANK Weekly Outlook and Analysis:
For the Week: (June 14,2021 – June 18,2021)
BSE: 532215| NSE: AXISBANK| ISIN: INE238A01034| SECTOR: BANKS
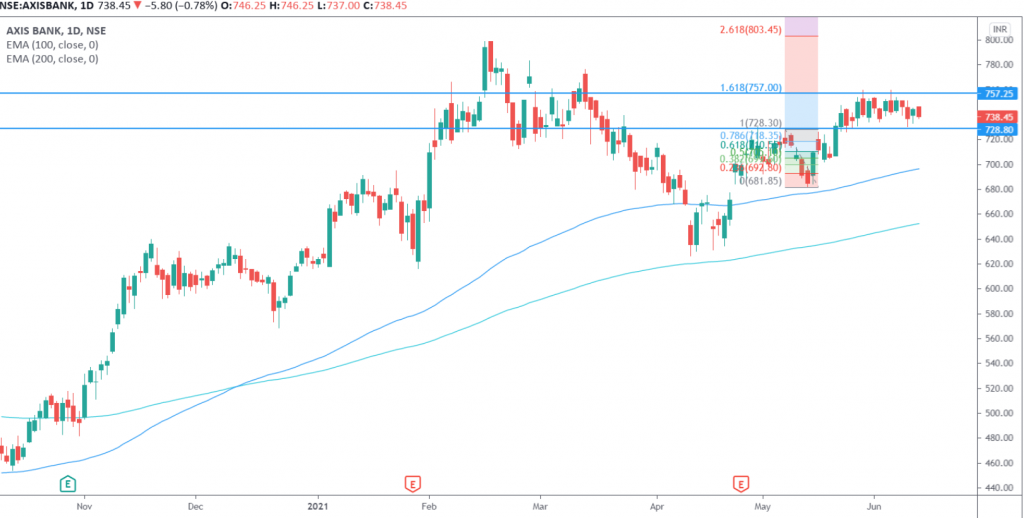
AXISBank Share Price: 738.45 (NSE)
AXISBank closed the Weekly on Negative Note Losing 0.49%
Weekly High: 753.95
Weekly Low: 730.15
Weekly Range: 23.80 Points
Weekly Support & Resistance For Axis Bank:
| RESISTANCE 2 | 765 |
| RESISTANCE 1 | 761 |
| SUPPORT 1 | 727 |
| SUPPORT 2 | 716 |
Technically on the daily charts EquityPandit’s Analyst see: Minor support on the downside lies at 727 levels, Minor resistance on the upside is capped around 761 levels.
If stock breaches minor support on the downside and closes below it we may see fresh break down and stock can drag towards Major Support on lower side @ 716 and If stock breaches minor resistance on the upside and closes above it we may see fresh breakout and stock can head towards Major Resistances Level @765
Stock is trading above 200 days exponential moving average, suggests long term trend is bullish. EquityPandit’s Predicts Range for the Weekly as 765 on upside and 716 on downside.
The present structure shows that AXIS BANK share price are moving in range-bound trade between 760-730 levels. For any directional movement stock need to break this range with strong momentum.
Stock is trading below 200 days exponential moving average, suggests long term trend is bearish. EquityPandit’s Predicts Range for the Weekly as 460 on upside and 407 on downside.
