 Live
Live
AXISBANK Weekly Outlook and Analysis:
For the Week: (March 08,2021 – March 12,2021)
BSE: 532215| NSE: AXISBANK| ISIN: INE238A01034| SECTOR: BANKS
AXIS Bank Share Price: 730.75 (NSE)
AXIS Bank closed the Weekly on Positive Note Gaining 0.82%
Weekly High: 760.80
Weekly Low: 720.50
Weekly Range: 40.30 Points
Weekly Support & Resistance For Axis Bank:
| RESISTANCE 2 | 776 |
| RESISTANCE 1 | 753 |
| SUPPORT 1 | 713 |
| SUPPORT 2 | 696 |
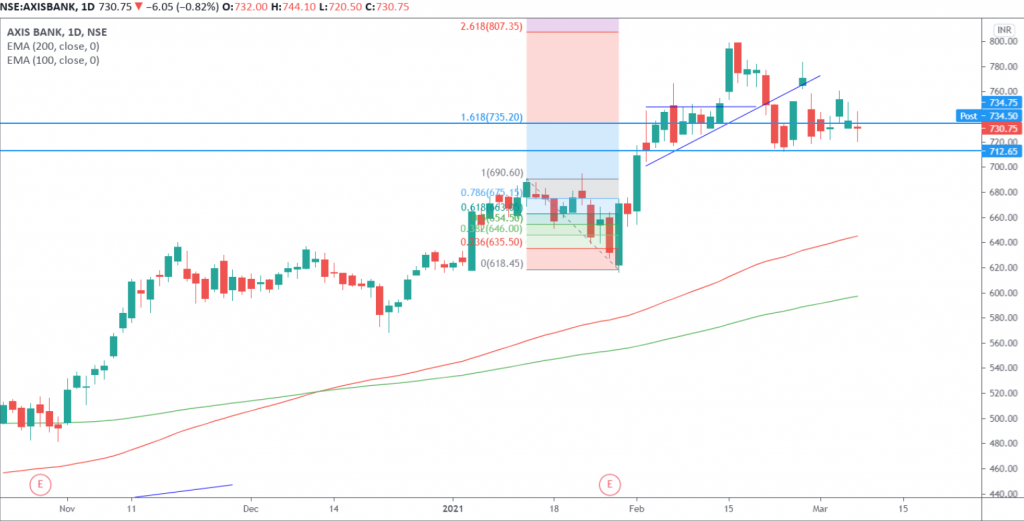
Technically on the daily charts EquityPandit’s Analyst see: Minor support on the downside lies at 713 levels, Minor resistance on the upside is capped around 753 levels.
If stock breaches minor support on the downside and closes below it we may see fresh break down and stock can drag towards Major Support on lower side @ 696 and If stock breaches minor resistance on the upside and closes above it we may see fresh breakout and stock can head towards Major Resistances Level @776
Stock is trading above 200 days exponential moving average, suggests long term trend is bullish. EquityPandit’s Predicts Range for the Weekly as 776 on upside and 696 on downside.
The present structure shows that AXIS BANK share closed below its important support 735 level. Price closed below 9day EMA support on daily chart .As long as it remains below the same, weakness can be seen towards 713-715 levels.
Stock is trading below 200 days exponential moving average, suggests long term trend is bearish. EquityPandit’s Predicts Range for the Weekly as 460 on upside and 407 on downside.
