 Live
Live
AXISBANK Weekly Outlook and Analysis:
For the Week: (March 15,2021 – March 19,2021)
BSE: 532215| NSE: AXISBANK| ISIN: INE238A01034| SECTOR: BANKS
AXISBank Share Price: 750.60 (NSE)
AXISBank closed the Weekly on Positive Note Gaining 2.72%
Weekly High: 776.60
Weekly Low: 732
Weekly Range: 44.60 Points
Weekly Support & Resistance For Axis Bank:
| RESISTANCE 2 | 796 |
| RESISTANCE 1 | 773 |
| SUPPORT 1 | 730 |
| SUPPORT 2 | 709 |
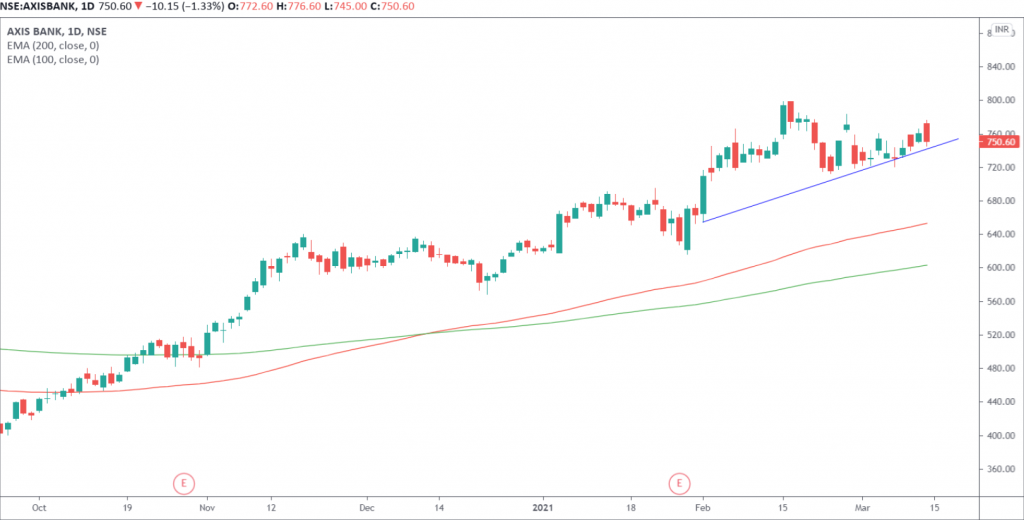
Technically on the daily charts EquityPandit’s Analyst see: Minor support on the downside lies at 730 levels, Minor resistance on the upside is capped around 773 levels.
If stock breaches minor support on the downside and closes below it we may see fresh break down and stock can drag towards Major Support on lower side @ 709 and If stock breaches minor resistance on the upside and closes above it we may see fresh breakout and stock can head towards Major Resistances Level @796
Stock is trading above 200 days exponential moving average, suggests long term trend is bullish. EquityPandit’s Predicts Range for the Weekly as 796 on upside and 709 on downside.
The present structure shows that AXIS BANK share trading above support trend line. A falling window occurred on the candles. The level of 740 would be crucial in the near term as any breach of this level will invite incremental weakness.
Stock is trading below 200 days exponential moving average, suggests long term trend is bearish. EquityPandit’s Predicts Range for the Weekly as 460 on upside and 407 on downside.
