 Live
Live
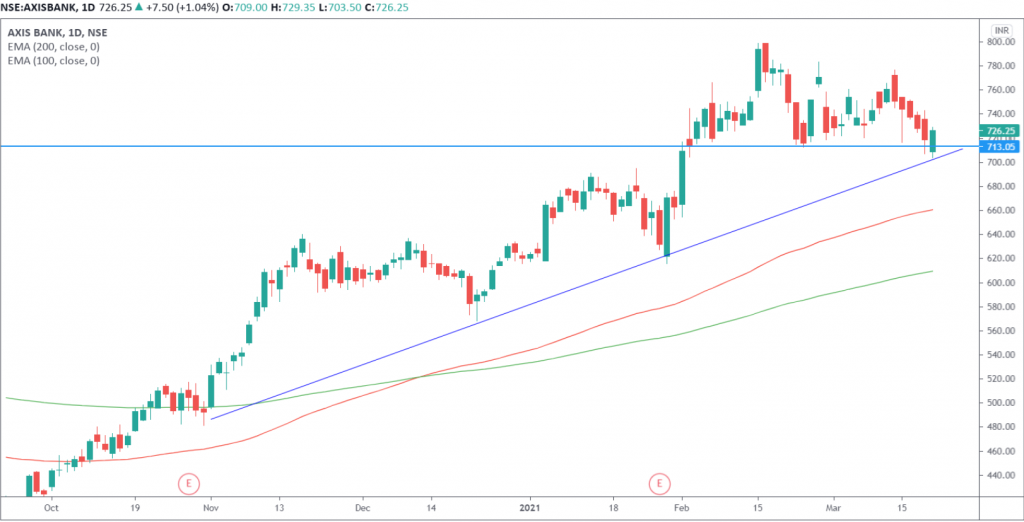
AXISBANK Weekly Outlook and Analysis:
For the Week: (March 22,2021 – March 26,2021)
BSE: 532215| NSE: AXISBANK| ISIN: INE238A01034| SECTOR: BANKS
AXISBank Share Price: 726.25 (NSE)
AXISBank closed the Weekly on Negative Note Losing 3.24%
Weekly High: 754
Weekly Low: 703.50
Weekly Range: 50.50 Points
Weekly Support & Resistance For Axis Bank:
| RESISTANCE 2 | 779 |
| RESISTANCE 1 | 753 |
| SUPPORT 1 | 702 |
| SUPPORT 2 | 677 |
Technically on the daily charts EquityPandit’s Analyst see: Minor support on the downside lies at 702 levels, Minor resistance on the upside is capped around 753 levels.
If stock breaches minor support on the downside and closes below it we may see fresh break down and stock can drag towards Major Support on lower side @677 and If stock breaches minor resistance on the upside and closes above it we may see fresh breakout and stock can head towards Major Resistances Level @779
Stock is trading above 200 days exponential moving average, suggests long term trend is bullish. EquityPandit’s Predicts Range for the Weekly as 779 on upside and 677 on downside.
The present structure shows that AXIS BANK share price manage to close above its important trend line support. To continue with up move, break above prior day high near 730 on closing basis is required where as 703 level will act as a support for stock.
Stock is trading below 200 days exponential moving average, suggests long term trend is bearish. EquityPandit’s Predicts Range for the Weekly as 460 on upside and 407 on downside.
