 Live
Live
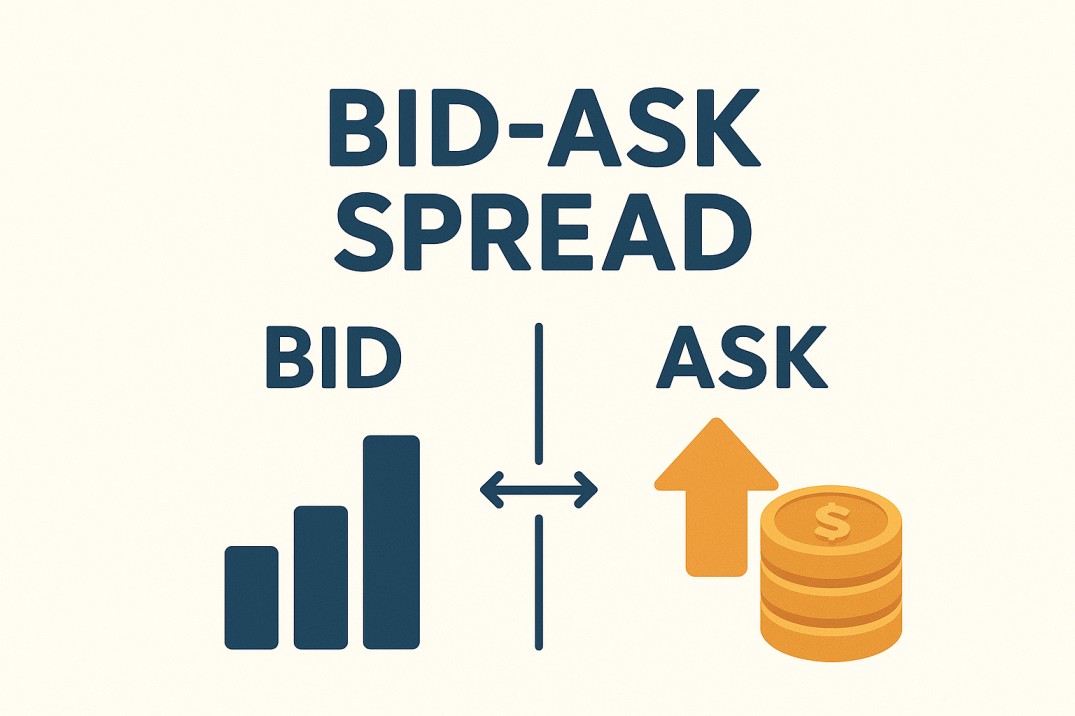
Every trade in the stock market is like a tiny negotiation — someone is willing to pay, and someone is willing to sell. The difference between what buyers are ready to pay and what sellers want is called the bid-ask spread. Though it may seem small, this gap is a powerful force shaping every transaction. Understanding it can reveal hidden market signals, trading opportunities, and even the real cost of investing. So, what does this seemingly tiny difference mean for your trades? Let’s dive in.
Understanding the Bid Price
The bid price is the highest amount a buyer is willing to pay for a stock or asset at a given time. Think of it as the top offer you put on the table when you want to buy.
For example, if you’re eyeing Stock X and willing to pay Rs 100, that becomes your bid. Sellers can see this price and decide if they want to accept it. Naturally, when many buyers offer strong bids, it signals that the stock is in demand — something traders always watch closely.
Understanding the Ask Price
On the other side, the ask price (or offer price) is the lowest amount a seller is ready to accept. Imagine it as the minimum price at which someone is willing to part with their stock.
For instance, if another trader wants to sell Stock X at Rs 102, that’s the ask. Buyers can agree or negotiate. More sellers quoting lower asks usually indicate higher supply or weaker demand for the stock.
Here’s the bridge: while the bid shows what buyers are ready to pay, the ask reveals what sellers want — and the gap between them is where the real story begins.
The Bid-Ask Spread and Why It Matters
The bid-ask spread is simply the difference between the bid price and the ask price. For example, if Stock X has a bid of Rs 100 and an ask of Rs 101, the spread is Re 1.
Why should you care? Because the size of this gap tells you about liquidity — how easily a stock can be bought or sold.
- A small spread usually means the stock is actively traded and easy to buy or sell (high liquidity).
- A large spread suggests fewer trades, making it costlier or harder to transact.
Simply put, the bid-ask spread isn’t just a number — it reflects the hidden costs of trading and guides smarter decisions on entry and exit points.
Calculating the Bid-Ask Spread
The math is straightforward:
Bid-Ask Spread = Ask Price − Bid Price
You can also express it as a percentage:
Bid-Ask Spread (%) = (Ask Price − Bid Price) ÷ Ask Price × 100
Example: Stock X on NSE
- Bid Price = Rs 98
- Ask Price = Rs 100
- Spread = Rs 2
- Spread (%) = 2%
A smaller spread is a sign of cheap and easy trading, while a wider spread means higher costs or lower liquidity.
Using the Bid-Ask Spread in Trading
Understanding the spread isn’t just theoretical — it can directly influence your trading strategy. Here’s how traders use it:
- Check the Spread: Narrow spreads mean lower costs and high liquidity; wide spreads signal higher costs.
- Understand Market Conditions: Active stocks usually have tight spreads, whereas low-volume or risky stocks show wide spreads.
- Use Limit Orders: Set your own price to buy or sell instead of relying on market orders.
- Trade During Active Hours: Early market hours (9:15 AM – 11:30 AM IST) often offer better prices and tighter spreads.
- Treat Spread as a Cost: Even low brokerage can’t offset losses from a wide spread — always factor it in.
Example: If you buy at Rs 101 (ask) and sell immediately at Rs 100 (bid), you lose Rs 1 instantly — that’s the spread at work.
Why the Bid-Ask Spread Matters
The bid-ask spread is more than a number — it’s a market indicator:
- Liquidity Check: Small spreads show many buyers and sellers; large spreads indicate low participation.
- Trading Costs: Wide spreads eat into profits quickly.
- Plan Entry and Exit: Traders can place limit orders between bid and ask for better prices.
- Market Sentiment: Tight spreads suggest in-demand, active stocks; wide spreads indicate uncertainty.
- Crucial for Short-Term Traders: Day traders and scalpers rely on narrow spreads to protect small gains.
Factors That Affect the Bid-Ask Spread
Several key factors shape this gap:
- Stock Liquidity: High-volume stocks like Reliance, TCS, or Infosys usually have narrow spreads. Low-volume or penny stocks often show wider spreads.
- Market Volatility: Sudden price swings widen spreads as traders protect themselves. Stable markets have tighter spreads.
- Supply and Demand: More buyers push bids up; more sellers lower asks. The balance determines the spread.
- Trading Hours: Peak hours (9:30 AM – 11:30 AM IST) show tighter spreads; opening, closing, or off-peak hours may widen spreads.
- News and Announcements: Earnings reports, policy changes, or global events can widen spreads as traders react cautiously.
Bottomline
The bid-ask spread is a small gap with big implications. It reflects market demand, shows liquidity, and signals the cost of trading. By understanding it, traders can:
- Make smarter entry and exit decisions
- Reduce hidden costs
- Gauge market sentiment and liquidity
- Protect profits in short-term trading
Next time you glance at a stock, don’t just see numbers — notice the bid, the ask, and the spread. It’s a subtle yet powerful tool that can help you trade smarter and more cost-effectively.
Ready to invest like a pro? Unicorn Signals app equips you with 100+ Free tools and knowledge you need to succeed. Download the Unicorn Signals app and gain access to daily stock lists and insightful market analysis and much more!
