 Live
Live
DABUR Weekly Outlook and Analysis:
For the Week: (June 05, 2021 – June 11, 2021)
BSE: 500096| NSE: DABUR| ISIN: INE016A01026| SECTOR: FMCG
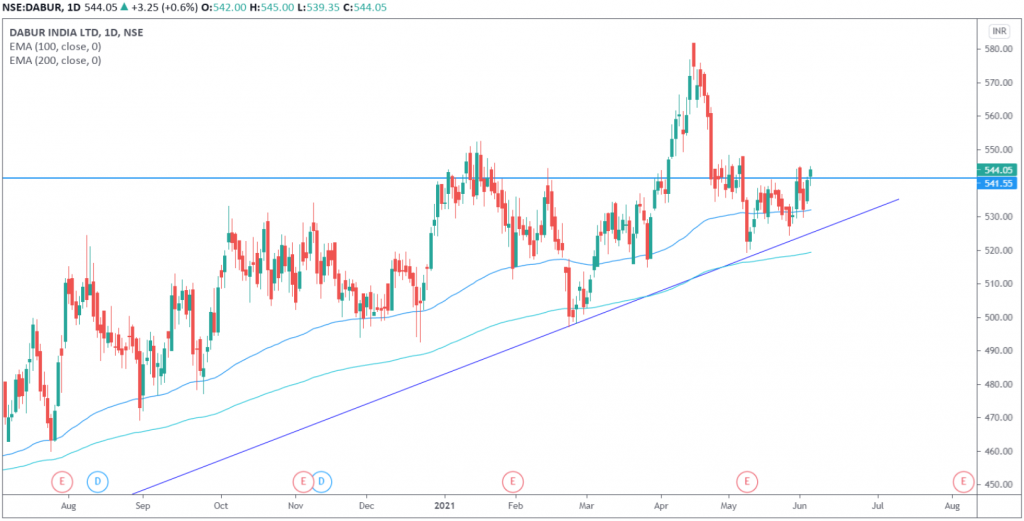
Dabur Share Price : 544.05 (NSE)
Dabur closed the Weekly on Positive Note Gaining 2.57%
Weekly High: 545
Weekly Low: 529.55
Weekly Range: 15.45 points
Weekly Support & Resistance for DABUR:
| RESISTANCE 2 | 554 |
| RESISTANCE 1 | 549 |
| SUPPORT 1 | 534 |
| SUPPORT 2 | 524 |
Technically on the daily charts EquityPandit’s Analyst see: Minor support on the downside lies at 534 levels, Minor resistance on the upside is capped around 549 levels.
If stock breaches minor support on the downside and closes below it we may see fresh break down and stock can drag towards Major Support on lower side @ 524 and If stock breaches minor resistance on the upside and closes above it we may see fresh breakout and stock can head towards Major Resistances Level @ 554
Stock is trading above 200 days exponential moving average, suggests long term trend is bullish. EquityPandit predicts range for the Weekly as 554 on upside and 524 on downside.
On the daily chart stock is moving in the form of Double Bottom pattern. The trend for DABUR INDIA LTD. Is clearly bullish . Price can continue to move towards 550 levels.
