 Live
Live
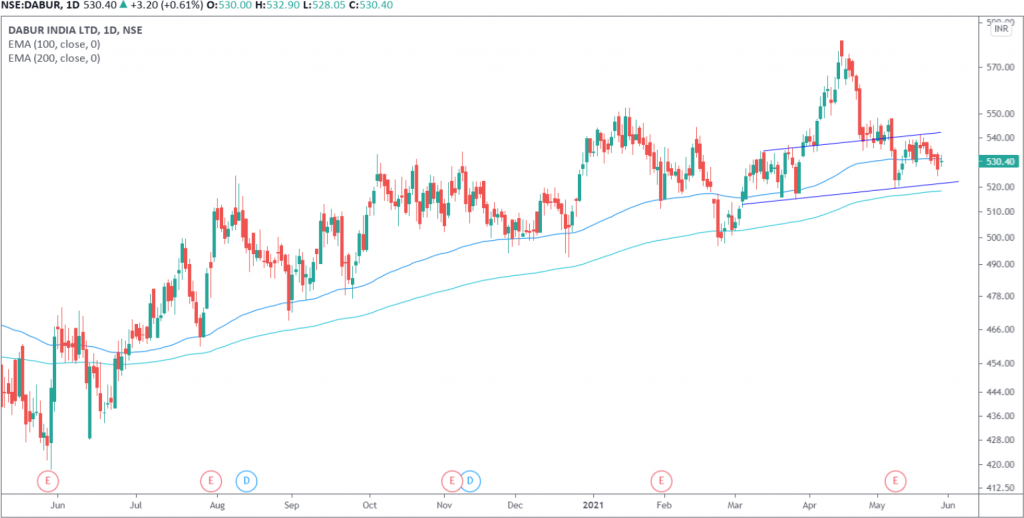
DABUR Weekly Outlook and Analysis:
For the Week: (May 31,2021 – June 04,2021)
BSE: 500096| NSE: DABUR| ISIN: INE016A01026| SECTOR: FMCG
Dabur Share Price : 530.40 (NSE)
Dabur closed the Weekly on Negative Note Losing 1.18%
Weekly High: 538.15
Weekly Low: 524.40
Weekly Range: 13.75 points
Weekly Support & Resistance for DABUR:
| RESISTANCE 2 | 545 |
| RESISTANCE 1 | 537 |
| SUPPORT 1 | 523 |
| SUPPORT 2 | 516 |
Technically on the daily charts EquityPandit’s Analyst see: Minor support on the downside lies at 523 levels, Minor resistance on the upside is capped around 537 levels.
If stock breaches minor support on the downside and closes below it we may see fresh break down and stock can drag towards Major Support on lower side @ 516 and If stock breaches minor resistance on the upside and closes above it we may see fresh breakout and stock can head towards Major Resistances Level @ 545
Stock is trading above 200 days exponential moving average, suggests long term trend is bullish. EquityPandit predicts range for the Weekly as 545 on upside and 516 on downside.
On the daily chart stock is moving in the form of Head and shoulder pattern. If we look from an immediate short-term angle, stock will not have any sustainable up move unless the resistance level 541 is taken out. Stock can take support near 520 level.
