 Live
Live
Check DRREDDY Full Analysis At Unicorn Signals
DRREDDY Weekly Outlook and Analysis:
For the Week: (July 18, 2022 – July 22, 2022)
Check DRREDDY Full Analysis At Unicorn Signals
BSE: 500180| NSE: DRREDDY| ISIN: INE040A01026| SECTOR: PHARMA
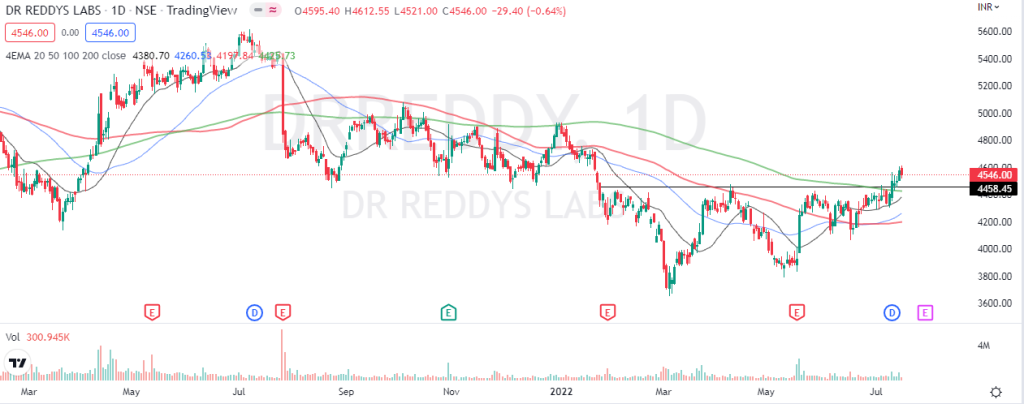
Stock closed the Weekly on Positive note gaining 3.17
Dr Reddy Share Price: 4546 (NSE)
Weekly High: 4612.55
Weekly Low: 4350.10
Weekly Range: 139.80 Points
Weekly Support & Resistance For DR. Reddy:
| RESISTANCE 2 | 4764 |
| RESISTANCE 1 | 4655 |
| SUPPORT 1 | 4393 |
| SUPPORT 2 | 4240 |
Technically on the daily charts EquityPandit’s Analyst see: Minor support on the downside lies at 4393 levels, Minor resistance on the upside is capped around 4655 levels.
If stock breaches minor support on the downside and closes below it we may see fresh break down and stock can drag towards Major Support on lower side @ 4240 and If stock breaches minor resistance on the upside and closes above it we may see fresh breakout and stock can head towards Major Resistances Level @ 4764.
Stock is trading above 200 days exponential moving average, suggests long term trend is bullish. EquityPandit predicts Range for the Weekly as 4794 on upside and 4240 on downside.
