 Live
Live
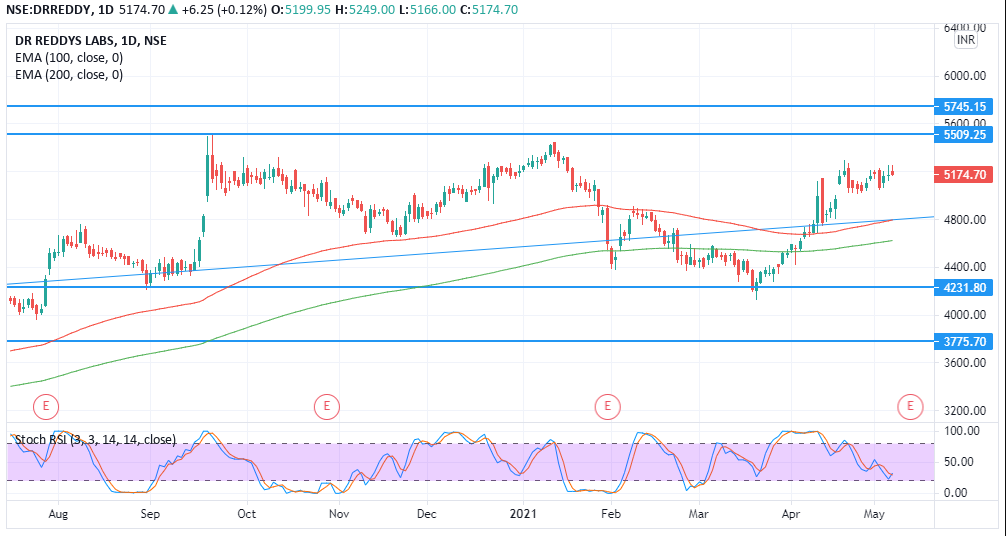
DRREDDY Weekly Outlook and Analysis:
For the Week: (May 10, 2021 – May 14, 2021)
BSE: 500180| NSE: DRREDDY| ISIN: INE040A01026| SECTOR: PHARMA
The stock closed the Weekly on a positive note gaining +0.22%
DrReddy Share Price: 5174.70 (NSE)
Weekly High: 5252.00
Weekly Low: 5054.35
Weekly Range: 197.65 Points
Weekly Support & Resistance For DR. Reddy:
| RESISTANCE 2 | 5750 |
| RESISTANCE 1 | 5510 |
| SUPPORT 1 | 4230 |
| SUPPORT 2 | 3775 |
Technically on the daily charts, EquityPandit’s Analyst sees: Minor support on the downside lies at 4230 levels, Minor resistance on the upside is capped around 5510 levels.
If stock breaches minor support on the downside and closes below it we may see a fresh break down and stock can drag towards Major Support on the lower side @ 3775 and If stock breaches minor resistance on the upside and closes above it we may see a fresh breakout and stock can head towards Major Resistances Level @ 5750.
Stock is trading above 200 days exponential moving average, which suggests the long term trend is bearish. EquityPandit predicts the Range for the Weekly as 5800 on the upside and 3700 on the downside.
On the daily chart of DrReddy, stock comes from the top and take support near 4800 price zone, stock in good positive trend and take
support of the trend line.
