 Live
Live
Check HDFC Full Analysis at Unicorn Signals
HDFC Bank Weekly Outlook and Analysis:
For the Week: (05-JUN-2023 to 09-JUN-2023)
BSE: 500180| NSE: HDFCBANK| ISIN: INE040A01026| SECTOR: BANKS
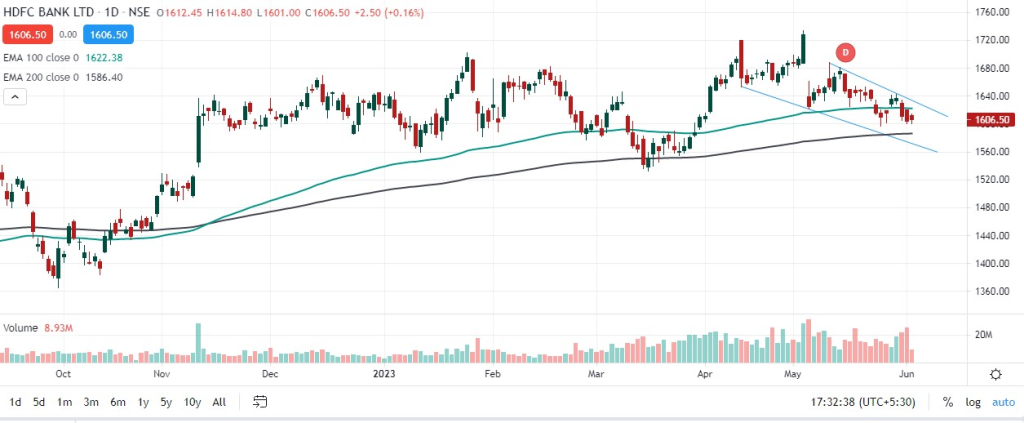
HDFC Bank Share Price: 1606.50 (NSE)
HDFC Bank closed the Week on Negative Note losing 0.58%
Weekly High: 1642.65
Weekly Low: 1600
Weekly Range: 42.65 Points
Weekly Support & Resistance For HDFC Bank:
| RESISTANCE 2 | 1659 |
| RESISTANCE 1 | 1632 |
| SUPPORT 1 | 1590 |
| SUPPORT 2 1574 | 1574 |
If stock breaches minor support on the downside and closes below it we may see fresh break down and stock can drag towards Ma-jor Support on lower side @1574 and If stock breaches minor resistance on the upside and closes above it we may see fresh break-out and stock can head towards Major Resistances Level @1659
Stock is trading above 200 days exponential moving average, suggests long term trend is bullish. EquityPandit’s Predicts Range for the Weekly as 1659 on upside and 1574 on downside.
