 Live
Live
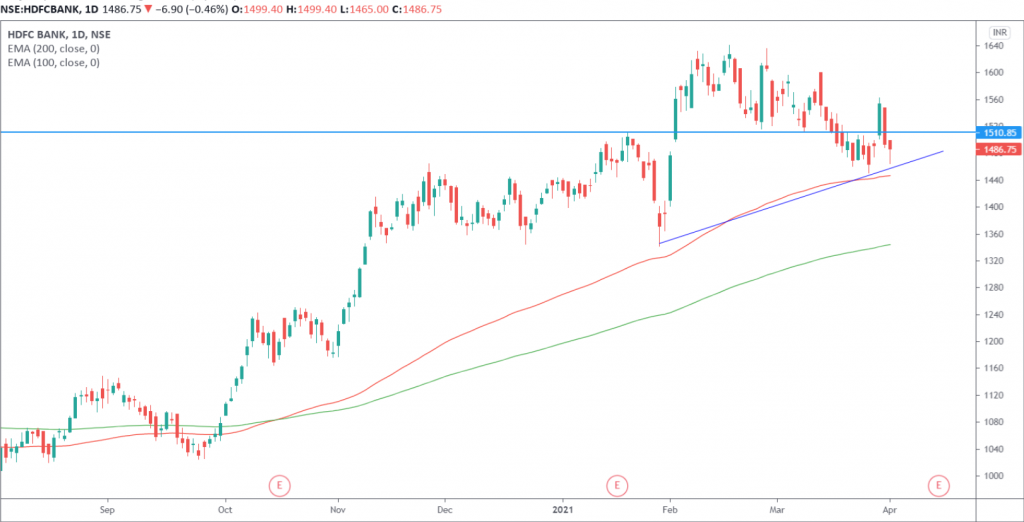
HDFCBANK Weekly Outlook and Analysis:
For the Week: (April 05,2021 – April 09,2021)
BSE: 500180| NSE: HDFCBANK| ISIN: INE040A01026| SECTOR: BANKS
HDFC Bank Share Price: 1486.75 (NSE)
HDFC Bank closed the Week on Negative Note Losing 0.31%
Weekly High: 1562.55
Weekly Low: 1465
Weekly Range: 97.55 Points
Weekly Support & Resistance For HDFC Bank:
| RESISTANCE 2 | 1601 |
| RESISTANCE 1 | 1544 |
| SUPPORT 1 | 1447 |
| SUPPORT 2 | 1407 |
Technically on the daily charts EquityPandit’s Analyst see: Minor support on the downside lies at 1447 levels, Minor resistance on the upside is capped around 1544 levels.
If stock breaches minor support on the downside and closes below it we may see fresh break down and stock can drag towards Major Support on lower side @1407 and If stock breaches minor resistance on the upside and closes above it we may see fresh breakout and stock can head towards Major Resistances Level @1601
Stock is trading above 200 days exponential moving average, suggests long term trend is bullish. EquityPandit’s Predicts Range for the Weekly as 1601 on upside and 1407 on downside.
On daily chart we can see that stock looks to be at crucial juncture but with bullish up move expecting. On the lower side, the 100 EMA is one of the most important support for the immediate near term.
