 Live
LiveHDFCBANK Weekly Outlook and Analysis:
For the Week: (April 12,2021 – April 16,2021)
BSE: 500180| NSE: HDFCBANK| ISIN: INE040A01026| SECTOR: BANKS
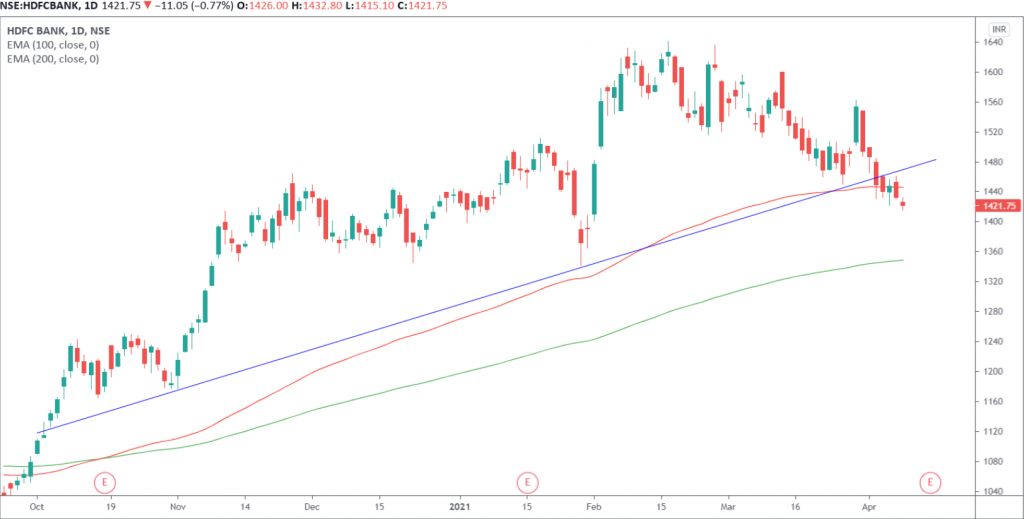
HDFC Bank Share Price: 1421.75 (NSE)
HDFC Bank closed the Week on Negative Note Losing 4.37%
Weekly High: 1485.00
Weekly Low: 1415.10
Weekly Range: 69.90 Points
Weekly Support & Resistance For HDFC Bank:
| RESISTANCE 2 | 1510 |
| RESISTANCE 1 | 1465 |
| SUPPORT 1 | 1395 |
| SUPPORT 2 | 1370 |
Technically on the daily charts EquityPandit’s Analyst see: Minor support on the downside lies at 1395 levels, Minor resistance on the upside is capped around 1465 levels.
If stock breaches minor support on the downside and closes below it we may see fresh break down and stock can drag towards Major Support on lower side @1370 and If stock breaches minor resistance on the upside and closes above it we may see fresh breakout and stock can head towards Major Resistances Level @1510
Stock is trading above 200 days exponential moving average, suggests long term trend is bullish. EquityPandit’s Predicts Range for the Weekly as 1510 on upside and 1370 on downside.
On daily chart we can see that stock price closed below trend line support. For the near term, 100 EMA has now become a temporary immediate top for the stock. No significant formation was noticed on the Candles.
