 Live
Live
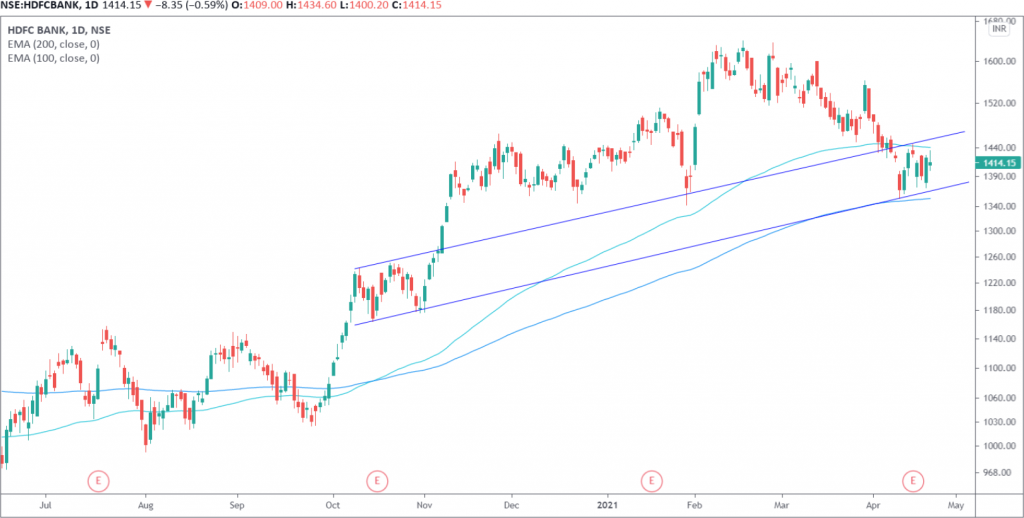
HDFCBANK Weekly Outlook and Analysis:
For the Week: (April 26,2021 – April 30,2021)
BSE: 500180| NSE: HDFCBANK| ISIN: INE040A01026| SECTOR: BANKS
HDFC Bank Share Price: 1414.15 (NSE)
HDFC Bank closed the Week on Negative Note Losing 1.08%
Weekly High: 1434.60
Weekly Low: 1371.05
Weekly Range: 63.55 Points
Weekly Support & Resistance For HDFC Bank:
| RESISTANCE 2 | 1470 |
| RESISTANCE 1 | 1441 |
| SUPPORT 1 | 1378 |
| SUPPORT 2 | 1343 |
Technically on the daily charts EquityPandit’s Analyst see: Minor support on the downside lies at 1378 levels, Minor resistance on the upside is capped around 1441 levels.
If stock breaches minor support on the downside and closes below it we may see fresh break down and stock can drag towards Ma-jor Support on lower side @1343 and If stock breaches minor resistance on the upside and closes above it we may see fresh breakout and stock can head towards Major Resistances Level @1470.
Stock is trading above 200 days exponential moving average, suggests long term trend is bullish. EquityPandit’s Predicts Range for the Weekly as 1470 on upside and 1343 on downside.
On daily chart we can see that stock is moving in range bound. If we look from an immediate short-term angle, stock will not have any sustainable up move unless this level of 1445 is taken out.
