 Live
Live
HDFCBANK Weekly Outlook and Analysis:
For the Week: (May 10, 2021 – May 14, 2021)
BSE: 500180| NSE: HDFCBANK| ISIN: INE040A01026| SECTOR: BANKS
HDFC Bank Share Price: 1414.75 (NSE)
HDFC Bank closed the Week on Positive Note Gaining 0.17%
Weekly High: 1424.95
Weekly Low: 1377.30
Weekly Range: 47.65 Points
Weekly Support & Resistance For HDFC Bank:
| RESISTANCE 2 | 1453 |
| RESISTANCE 1 | 1433 |
| SUPPORT 1 | 1385 |
| SUPPORT 2 | 1357 |
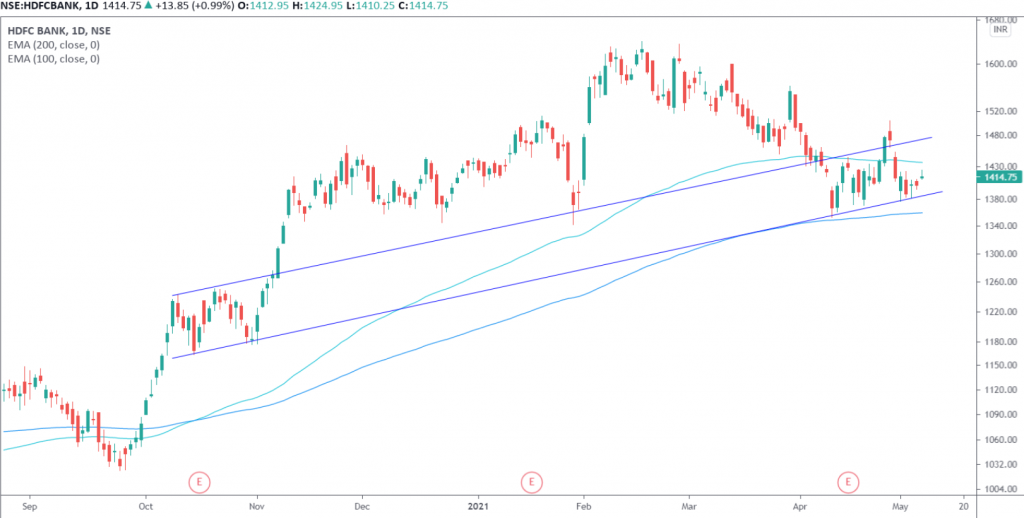
Technically on the daily charts, EquityPandit’s Analyst sees: Minor support on the downside lies at 1385 levels, Minor resistance on the upside is capped around 1433 levels.
If stock breaches minor support on the downside and closes below it we may see a fresh break down and stock can drag towards Ma-jor Support on the lower side @1357 and If stock breaches minor resistance on the upside and closes above it we may see a fresh breakout and stock can head towards Major Resistances Level @1453.
Stock is trading above 200 days exponential moving average, which suggests the long term trend is bullish. EquityPandit’s Predicts Range for the Weekly as 1453 on the upside and 1357 on the downside.
On the daily chart, we can see that stock again closed below 100 EMA support in the last trading session. A Doji candle occurred on the daily chart. The stock has good support at 1380-1377 levels.
