 Live
Live
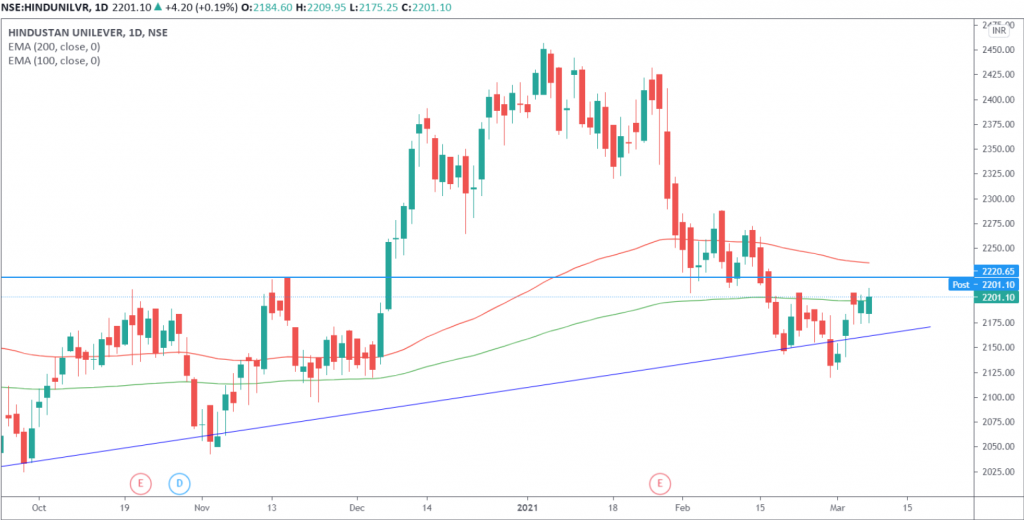
HINDUNILVR Weekly Outlook and Analysis:
For the Week: (March 08,2021 – March 12,2021)
BSE: 500696| NSE: HINDUNILVR| ISIN: INE030A01027| SECTOR: FMCG
HUL Share Price: 2201.10(NSE)
HUL closed the Week on Positive Note Gaining 3.24%
Weekly High: 2209.95
Weekly Low: 2128
Weekly Range: 81.95 points
Weekly Support & Resistance for HUL:
| RESISTANCE 2 | 2260 |
| RESISTANCE 1 | 2230 |
| SUPPORT 1 | 2150 |
| SUPPORT 2 | 2098 |
Technically on the daily charts EquityPandit’s Analyst see: Minor support on the downside lies at 2150 Levels, Minor resistance on the upside is capped around 2230 levels.
If stock breaches minor support on the downside and closes below it we may see fresh break down and stock can drag towards Major Support on lower side @ 2098 and If stock breaches minor resistance on the upside and closes above it we may see fresh breakout and stock can head towards Major Resistances Level @2260
Stock is trading above 200 days exponential moving average, suggests long term trend is bullish. EquityPandit predicts range for the Weekly as 2260 on upside and 2098 on downside.
On the daily charts we can see that stock is moving in consolidation zone in past few days. Stock manage to close above 200 EMA support on daily chart. To further up move stock need to break above its important resistance 2220 level.
