 Live
Live
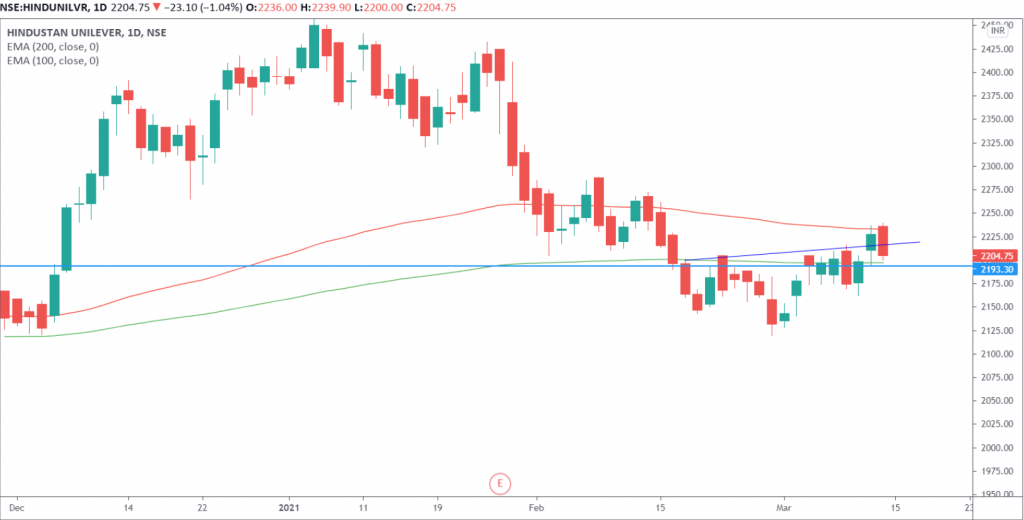
HINDUNILVR Weekly Outlook and Analysis:
For the Week: (March 15,2021 – March 19,2021)
BSE: 500696| NSE: HINDUNILVR| ISIN: INE030A01027| SECTOR: FMCG
HUL Share Price: 2204.75 (NSE)
HUL closed the Week on Positive Note Gaining 0.17%
Weekly High: 2239.90
Weekly Low: 2162.05
Weekly Range: 77.85 points
Weekly Support & Resistance for HUL:
| RESISTANCE 2 | 2280 |
| RESISTANCE 1 | 2242 |
| SUPPORT 1 | 2165 |
| SUPPORT 2 | 2125 |
Technically on the daily charts EquityPandit’s Analyst see: Minor support on the downside lies at 2165 Levels, Minor resistance on the upside is capped around 2242 levels.
If stock breaches minor support on the downside and closes below it we may see fresh break down and stock can drag towards Major Support on lower side @ 2125 and If stock breaches minor resistance on the upside and closes above it we may see fresh breakout and stock can head towards Major Resistances Level @2280
Stock is trading above 200 days exponential moving average, suggests long term trend is bullish. EquityPandit predicts range for the Weekly as 2280 on upside and 2125 on downside.
On the daily charts we can see that Bearish engulfing pattern which indicates more weakness. Stock manage to close above 200 EMA support on daily chart. In short trend If price moves below this support we can see more weakness towards downside .
