 Live
Live
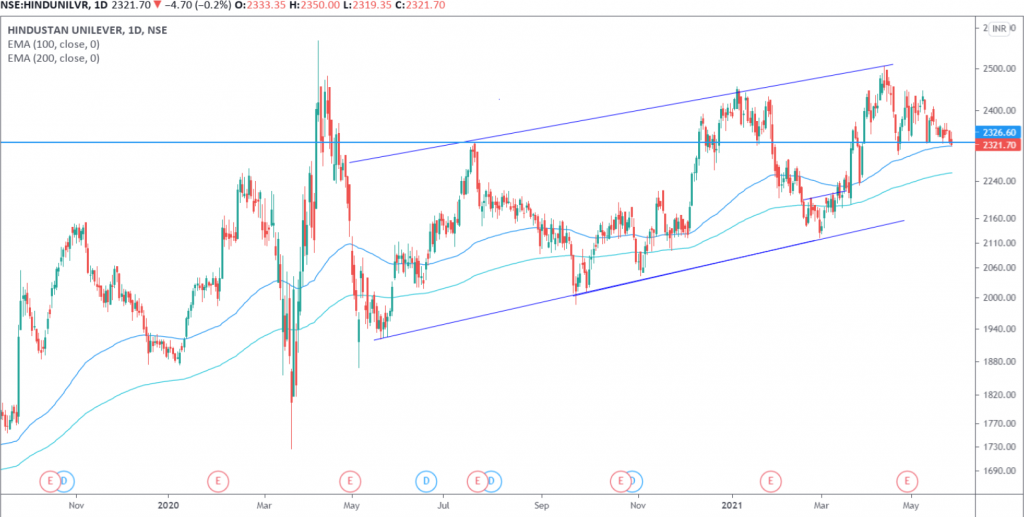
HINDUNILVR Weekly Outlook and Analysis:
For the Week: (May 31,2021 – June 04,2021)
BSE: 500696| NSE: HINDUNILVR| ISIN: INE030A01027| SECTOR: FMCG
HUL Share Price: 2321.70 (NSE)
HUL closed the Week on Negative Note Losing 1.72%
Weekly High: 2370.20
Weekly Low: 2319.35
Weekly Range: 50.85 points
Weekly Support & Resistance for HUL:
| RESISTANCE 2 | 2390 |
| RESISTANCE 1 | 2350 |
| SUPPORT 1 | 2300 |
| SUPPORT 2 | 2285 |
Technically on the daily charts EquityPandit’s Analyst see: Minor support on the downside lies at 2300 Levels, Minor resistance on the upside is capped around 2350 levels.
If stock breaches minor support on the downside and closes below it we may see fresh break down and stock can drag towards Major Support on lower side @ 2285 and If stock breaches minor resistance on the upside and closes above it we may see fresh breakout and stock can head towards Major Resistances Level @2390
Stock is trading above 200 days exponential moving average, suggests long term trend is bullish. EquityPandit predicts range for the Weekly as 2390 on upside and 2285 on downside.
On daily chart we can see that share price are sustaining above 100 EMA support. The level of 2300 would be crucial in the near term as any breach below this level will invite incremental weakness.
