 Live
Live
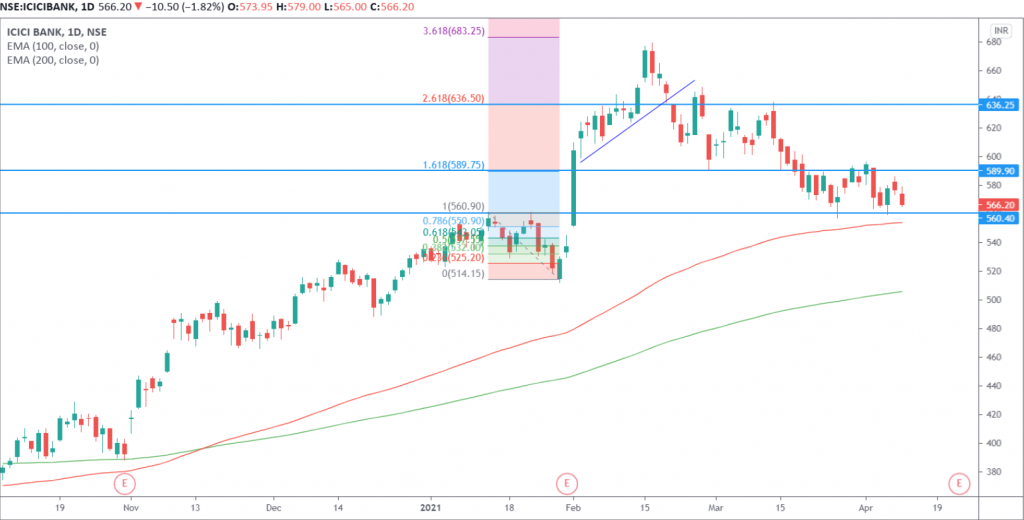
ICICIBANK Weekly Outlook and Analysis:
For the Week: (April 12,2021 – April 16,2021)
BSE: 532174| NSE: ICICIBANK| ISIN: INE090A01021| SECTOR: BANKS
ICICIBank Share Price : 566.20 (NSE)
ICICIBank closed the Week on Negative Note Losing 4.74%
Weekly High: 592.00
Weekly Low: 559.40
Weekly Range: 32.60 Points
Weekly Support & Resistance For ICICI Bank:
| RESISTANCE 2 | 606 |
| RESISTANCE 1 | 585 |
| SUPPORT 1 | 552 |
| SUPPORT 2 | 539 |
Technically on the daily charts EquityPandit’s Analyst see: Minor support on the downside lies at 552 levels, Minor resistance on the upside is capped around 585 levels.
If stock breaches minor support on the downside and closes below it we may see fresh break down and stock can drag towards Major Support on lower side @ 539 and If stock breaches minor resistance on the upside and closes above it we may see fresh breakout and stock can head towards Major Resistances Level @ 606
Stock is trading above 200 days exponential moving average, suggests long term trend is bullish. EquityPandit’s Predicts Range for the Weekly as 606 on upside and 539 on downside.
Present structure shows stock is trading in range bound between 590-560 levels. For the near term, the zone of 561-560 level has now become a key support for the stock.
