 Live
Live
ICICIBANK Weekly Outlook and Analysis:
For the Week: (June 14,2021 – June 18,2021)
BSE: 532174| NSE: ICICIBANK| ISIN: INE090A01021| SECTOR: BANKS
ICICIBank Share Price : 635.70 (NSE)
ICICIBank closed the Week on Negative Note Losing 1.09%
Weekly High: 650
Weekly Low: 628.80
Weekly Range: 21.20 Points
Weekly Support & Resistance For ICICI Bank:
| RESISTANCE 2 | 660 |
| RESISTANCE 1 | 647 |
| SUPPORT 1 | 626 |
| SUPPORT 2 | 617 |
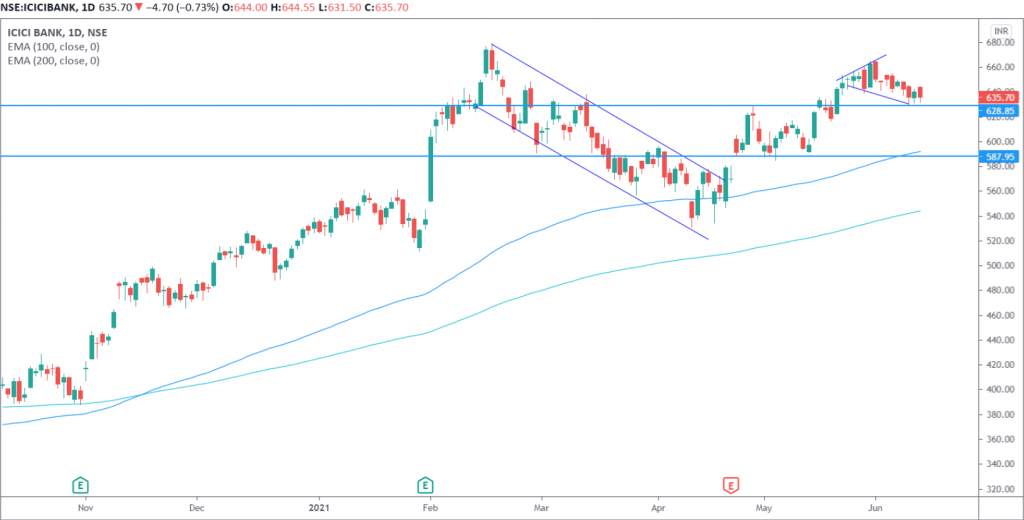
Technically on the daily charts EquityPandit’s Analyst see: Minor support on the downside lies at 626 levels, Minor resistance on the upside is capped around 647 levels.
If stock breaches minor support on the downside and closes below it we may see fresh break down and stock can drag towards Major Support on lower side @ 617 and If stock breaches minor resistance on the upside and closes above it we may see fresh breakout and stock can head towards Major Resistances Level @ 660
Stock is trading above 200 days exponential moving average, suggests long term trend is bullish. EquityPandit’s Predicts Range for the Weekly as 660 on upside and 617 on downside.
In the daily time frame, we can see ICICIBANK share prices are sustaining above the key support line. Stock is placed at a crucial support near 628 level and there were two possibilities either break above or reversed from the same level.
