 Live
Live
ICICIBANK Weekly Outlook and Analysis:
For the Week: (March 08,2021 – March 12,2021)
BSE: 532174| NSE: ICICIBANK| ISIN: INE090A01021| SECTOR: BANKS
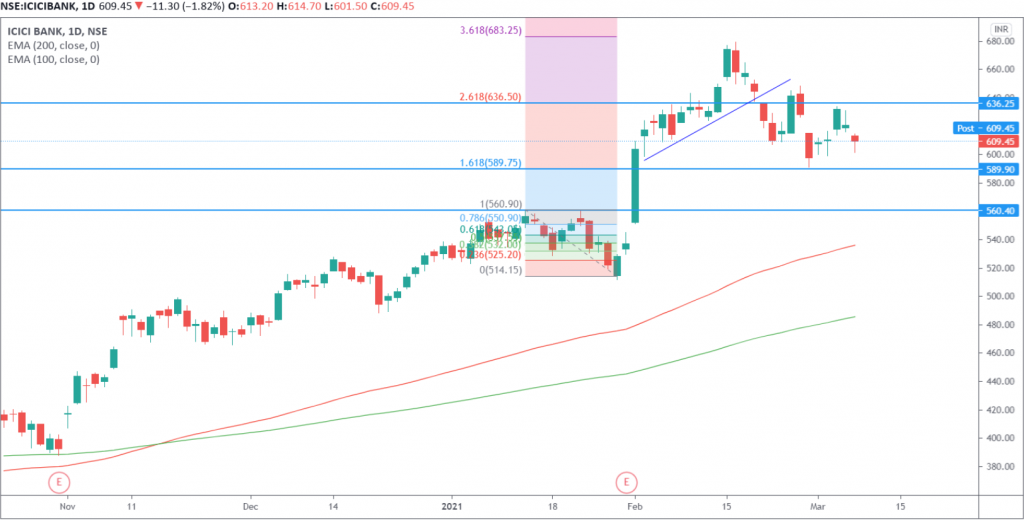
ICICI Bank Share Price : 609.45 (NSE)
ICICI Bank closed the Week on Positive Note Gaining 1.96%
Weekly High: 633.75
Weekly Low: 599
Weekly Range: 34.75 Points
Weekly Support & Resistance For ICICI Bank:
| RESISTANCE 2 | 647 |
| RESISTANCE 1 | 628 |
| SUP PORT 1 | 594 |
| SUPPORT 2 | 580 |
Technically on the daily charts EquityPandit’s Analyst see: Minor support on the downside lies at 594 levels, Minor resistance on the upside is capped around 628 levels.
If stock breaches minor support on the downside and closes below it we may see fresh break down and stock can drag towards Major Support on lower side @ 580 and If stock breaches minor resistance on the upside and closes above it we may see fresh breakout and stock can head towards Major Resistances Level @ 647
Stock is trading above 200 days exponential moving average, suggests long term trend is bullish. EquityPandit’s Predicts Range for the Weekly as 647 on upside and 580 on downside.
Present structure shows that ICICI BANK share price manage to close above its 589-590 level ,key support zone on daily chart. In short trend If price moves below this support 589 level, we can see more weakness towards downside .
