 Live
Live
ICICIBANK Weekly Outlook and Analysis:
For the Week: (March 15,2021 – March 19,2021)
BSE: 532174| NSE: ICICIBANK| ISIN: INE090A01021| SECTOR: BANKS
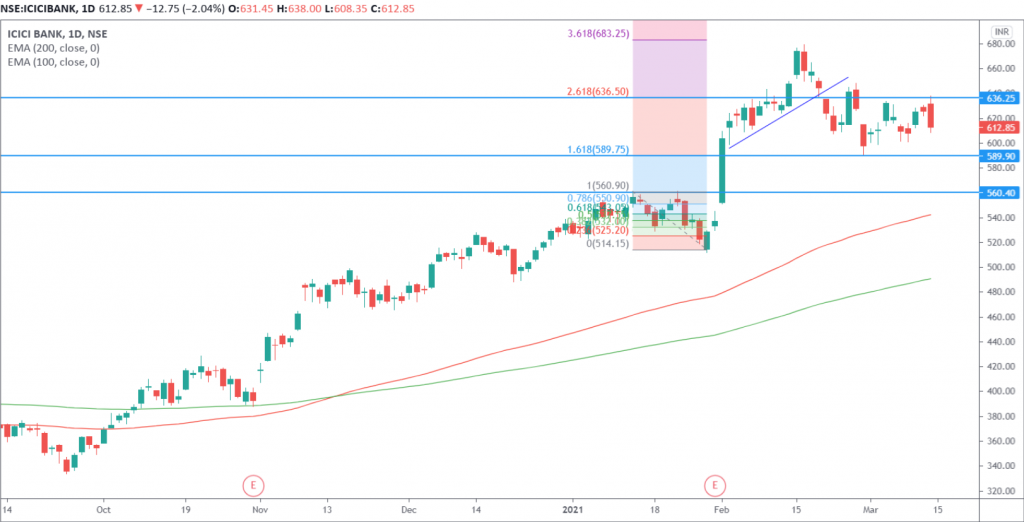
ICICIBank Share Price : 612.85 (NSE)
ICICIBank closed the Week on Positive Note Gaining 0.56%
Weekly High: 638
Weekly Low: 601.15
Weekly Range: 36.85 Points
Weekly Support & Resistance For ICICI Bank:
| RESISTANCE 2 | 653 |
| RESISTANCE 1 | 633 |
| SUPPORT 1 | 597 |
| SUPPORT 2 | 581 |
Technically on the daily charts EquityPandit’s Analyst see: Minor support on the downside lies at 597 levels, Minor resistance on the upside is capped around 633 levels.
If stock breaches minor support on the downside and closes below it we may see fresh break down and stock can drag towards Major Support on lower side @ 581 and If stock breaches minor resistance on the upside and closes above it we may see fresh breakout and stock can head towards Major Resistances Level @ 653
Stock is trading above 200 days exponential moving average, suggests long term trend is bullish. EquityPandit’s Predicts Range for the Weekly as 653 on upside and 581 on downside.
Present structure shows that ICICI BANK seems to be sideways. For the near term, the zone of 636-638 level has now become a temporary immediate resistance for the stock. In short trend If price moves above this resistance we can see more buying on upside.
