


ITC Outlook Weekly and Analysis:
For the Week: (June 14,2021 – June 18,2021)
BSE: 500857| NSE: ITC| ISIN: INE154A01025 | SECTOR: FMCG
ITC Share Price: 207.90 (NSE)
ITC closed the Week on Positive Note Gaining 2.38%
Weekly High: 211.40
Weekly Low: 204.50
Weekly Range: 6.90 points
Weekly Support & Resistance for ITC Limited:
| RESISTANCE 2 | 214 |
| RESISTANCE 1 | 211 |
| SUPPORT 1 | 204 |
| SUPPORT 2 | 201 |
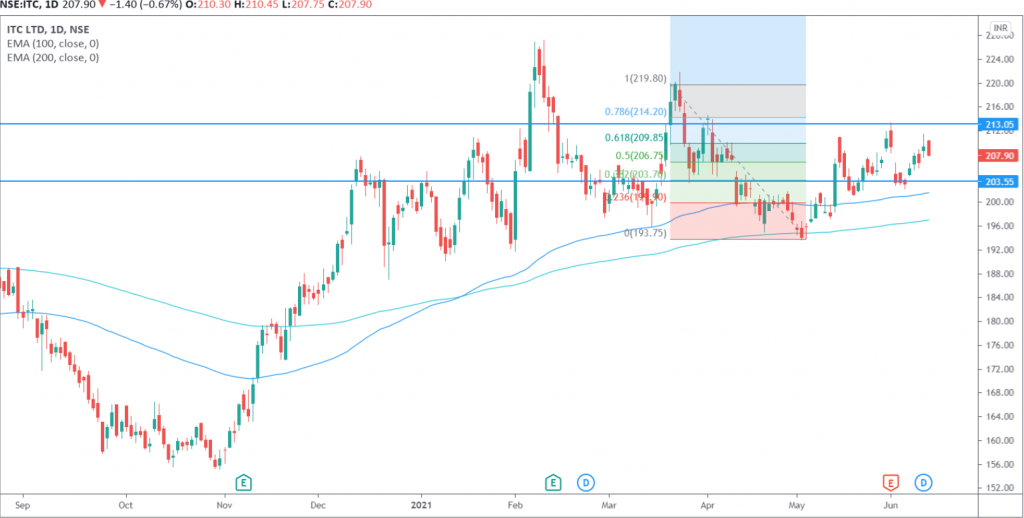
Technically on the daily charts EquityPandit’s Analyst see: Minor support on the downside lies at 204 Levels, Minor resistance on the upside is capped around 211 levels.
If stock breaches minor support on the downside and closes below it we may see fresh break down and stock can drag towards Major Support on lower side @ 201 and If stock breaches minor resistance on the upside and closes above it we may see fresh breakout and stock can head towards Major Resistances Level @ 214
Stock is trading above 200 days exponential moving average, suggests long term trend is bullish. EquityPandit predicts range for the Weekly as 214 on upside and 201 on downside.
On the daily chart we can see that ITC share prices are moving in a range -bound trade between 202-214 levels since past one month.
A Bearish Engulfing candle appeared on the chart in previous session. Prices can take support again near 202-203 levels.
