 Live
Live
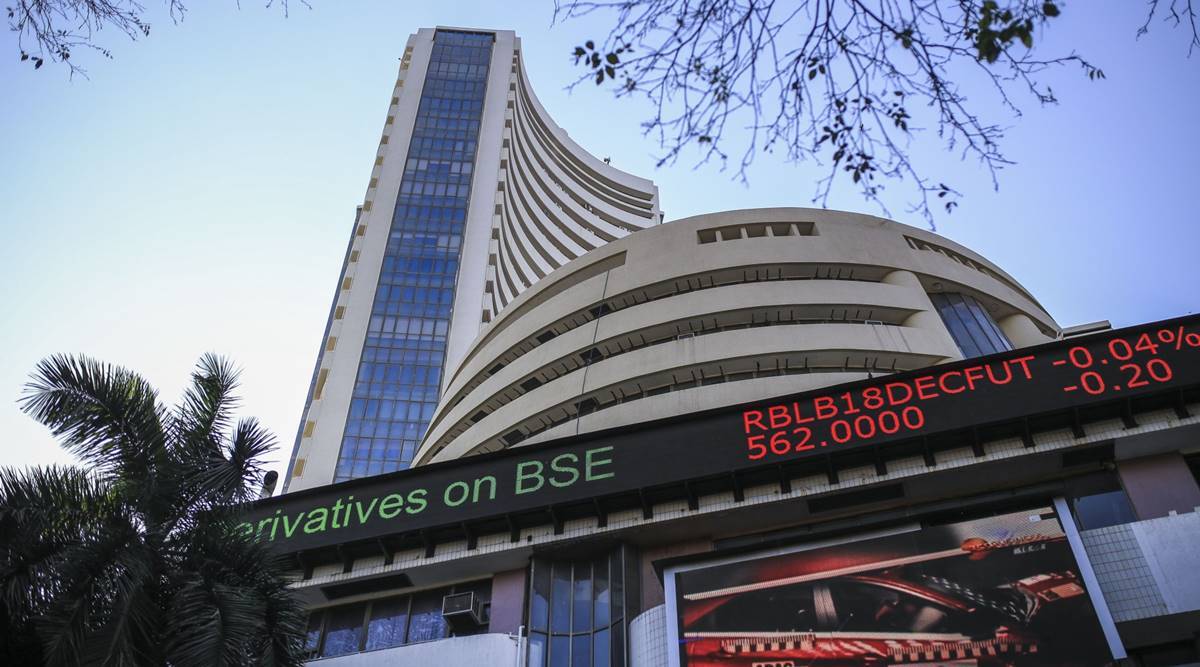
India’s oldest index, the S&P BSE SENSEX, gets its name from the amalgamation of “Sensitive Index”. The Sensex is the most-watched stock index in India and is still a favourite among old-timers.
The stock market of any country is the barometer of its economic growth, and Sensex has narrated how India has grown from strength to strength. Sensex and stock markets, as a whole, contribute to the Indian economy crossing $3 trillion in GDP post 75 years of Independence.
First published in January 1986, the index has the base year 1978-79. The Sensex is a free-float index based on the Weighted-Market Capitalisation of 30 of the biggest listed companies on the Bombay Stock Exchange (BSE). While there have been periods of volatility, the index has posted robust growth.
Over the last 43 years or around 11,000 trading days, the Sensex has delivered 15.5% CAGR, excluding an average dividend yield of 1.4%. If we consider a 16.9% compounding rate from its inception, the value of the index should be around 80,000 points.
Here is some interesting data about the ups and downs of the index.
| Positive | Negative | |
| Daily | 53% | 47% |
| Weekly | 56% | 44% |
| Monthly | 61% | 39% |
| Quarterly | 64% | 36% |
| Yearly | 72% | 28% |
| 3 years | 89% | 11% |
| 5 years | 96% | 4% |
| 10 years | 100% | 0% |
The longest period where the Iindex did not provide positive returns was 9 years, from 1994 to 2003, recovering eventually. If you had invested in any Sensex ETF since 2002 and held that investment for at least 7 years, you would have never made a loss.
NO SINGLE SEVEN-YEAR ROLLING PERIOD RESULTED IN NEGATIVE RETURNS.
Although equity returns may not be linear, long-term investing guarantees solid compounding returns.
However, the index’s journey has not been close to smooth.
Key Moments in the Journey of Sensex
1991-92: Liberalisation and Scams
On July 24, 1991, Former PM Manmohan Singh introduced measures to Liberalise the Indian economy to control the high inflation and a balance of payment crisis. Sensex rallied almost 30% in just the next 2 months, touching the 2000-mark in January 1992.
Post the liberalisation era, the Indian markets witnessed a tug-of-war between the bears and the bulls. Sensex rose almost 2,500 points in the first 4 months of 1992, led by the Harshad Mehta Bull Run. The index was rising 20-40% monthly in the first quarter.
When the scam was discovered, the index lost most of its gains in just 2 months. It fell nearly 45%, reaching 2595 points in the first week of August from 4,546 points at the start of April.
1999-2001: The Dot-com Bubble
In 1999, when the technology bubble was building up, Sensex rose 63%. After the bubble burst, Sensex tanked more than 55% in the next one and a half years starting February 2001.
2008-09: Global financial crisis
During the 2008-2009 global financial crisis, the Sensex fell by more than 50%, from about 21,000 points at the start of 2008 to around 8,000 points by March 2009. The index plummeted by 1070 points on just October 23 2008.
The then-ruling United Progressive Alliance (UPA) coalition was declared the winner of the Lok Sabha elections on May 16, 2009. The next trading day, May 18, the Sensex gained 2,110 points, its largest intra-day rise. Trading was halted for the day for the first time in Indian market history due to markets exceeding the upper circuit limit.
2014-19: The Modi Government
The Sensex in India reached a new high of over 25,000 after the Narendra Modi-led BJP won a landslide victory on May 16, 2014. The Sensex gained 1,470 points in the month.
The Goods and Services Tax (GST), India’s largest tax reform, was implemented on July 1, 2017, and resulted in a 10% increase in the Sensex by the end of the year.
The Sensex surpassed 40,000 points following PM Modi’s victory in the Lok Sabha election for a second term in 2019.
2020: COVID-19 and its Vaccine
The coronavirus disease outbreak shook the Markets. Sensex peaked in mid-January 2020 and lost around 40% till March 2020. The index saw its sharpest inter-day decline ever of 13.15% or 3,934 points on March 23, 2020, a day before the declaration of a nationwide lockdown.
Sensex Milestones
| Milestone | Month and Year(Sensex Closed Above Milestone) |
| 1,000 | July 1990 |
| 2,000 | January 1992 |
| 5,000 | October 1999 |
| 10,000 | February 2006 |
| 20,000 | December 2007 |
| 30,000 | April 2017 |
| 40,000 | June 2019 |
| 50,000 | February 2021 |
| 60,000 | September 2021 |
The BSE SENSEX has been a symbol of the country’s economic growth and development, with its share of ups and downs since its inception in 1986. The Sensex has witnessed significant events that impacted India’s economy, with each event having a unique impact on the index.
Despite the volatile journey, the Sensex has continued to grow and post new milestones, with the latest 60,000 reached in September 2021. The index’s long-term performance indicates that equity returns may not be linear but guarantee solid compounding returns. The Sensex will continue to be watched by investors worldwide.
