 Live
Live
Ever felt like the market moves in mysterious ways—up one moment, down the next, leaving you scrambling to catch up? That’s where pivot points step in. Think of them as your secret roadmap through the chaos—a way to spot where prices might stall, reverse, or surge. Instead of chasing every swing, pivot points help you ride the trend confidently, plan your moves, and make smarter decisions.
By the end of this guide, you’ll see how these simple yet powerful levels can give you a sharper edge in the market, whether you’re trading Nifty, Bank Nifty, or individual stocks.
Understanding Pivot Points
Pivot points are key price levels that help traders read the market and identify potential support and resistance zones. They’re calculated using the previous day’s high, low, and closing prices.
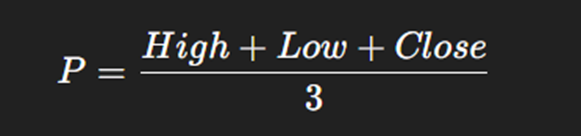
- The main pivot point (P) is the average of these three values.
- From this pivot, other levels like support (S1, S2) and resistance (R1, R2) are derived.
How traders interpret them:
- Price above the pivot → bullish signal (buying opportunity)
- Price below the pivot → bearish signal (selling opportunity)
- Price between S1 and R1 → sideways or range-bound market; ideal for quick intraday trades
Pivot points give a snapshot of market sentiment and help you plan trades rather than guess.
Calculating Pivot Points Made Easy
You don’t need a finance degree to calculate pivot points. Here’s the standard method:
Main Pivot Point (P):
Support and Resistance Levels:
Support:
- S1 = (2 × Pivot) − High → first level where price may bounce
- S2 = Pivot − (High − Low) → stronger support if S1 breaks
Resistance:
- R1 = (2 × Pivot) − Low → first level where price may stall or reverse
- R2 = Pivot + (High − Low) → next resistance if R1 is breached
Example:
If yesterday’s high was 105, low 95, and close 100:
- P = (105 + 95 + 100)/3 = 100
- S1 = (2 × 100) − 105 = 95
- R1 = (2 × 100) − 95 = 105
You can already see how prices may move between these levels.
Breakout cues:
- Price breaks above R1 with strong volume → may target R2 → consider buying
- Price falls below S1 → may move to S2 → consider selling
Pivot points act like road signs, helping you navigate trends and reversals.
Types of Pivot Points
Different trading styles call for different pivot point variations:
1. Fibonacci Pivot Points
Uses Fibonacci ratios (0.382, 0.618, 1.000) to highlight possible reversal zones. Great for trending or volatile markets.
2. Camarilla Pivot Points
Tighter levels for short-term intraday or scalp trading. Good for spotting quick moves.
3. Woodie’s Pivot Points
Gives more weight to the previous day’s closing price. Useful for trades around market open.
4. Demark Pivot Points
Focuses on the relationship between open and close. Produces just one support and resistance level, keeping charts clean.
Each type adapts to different market rhythms—whether you’re day trading or analyzing weekly trends.
Why Pivot Points Matter
Pivot points simplify trading decisions:
- Spot trends instantly: Above pivot → bullish, below pivot → bearish
- Identify support/resistance zones: Helps with precise entries, exits, and stop-losses
- Ideal for intraday trades: Based on previous day prices, useful in Nifty, Bank Nifty, or fast-moving stocks
- Easy to access: Many trading platforms automatically provide pivot levels
In short, pivot points give traders a quick, reliable map of the market.
Trading with Pivot Points
Here’s how to use them effectively:
1. Spot the Trend
- Market opens above Pivot (P) → bullish → look for buying opportunities
- Market opens below Pivot (P) → bearish → look for selling opportunities
2. Use Support and Resistance
- Price near S1/S2 showing bounce → buy, stop-loss just below support
- Price near R1/R2 starting to fall → sell, stop-loss just above resistance
3. Trade Breakouts
- Price breaks R1 with strong volume → may go to R2 → buy
- Price breaks S1 → may fall to S2 → sell
4. Combine with Other Tools
Indicators like RSI, MACD, or moving averages can confirm pivot signals.
5. Profit Booking
- Buy near Pivot/S1 → target R1/R2
- Sell near R1 → target Pivot/S1
Tip: High-volatility days (budget announcements, RBI decisions) may break multiple pivot levels, while low-volatility days may confine prices between S1 and R1.
Strategies Using Pivot Points
Pivot points work best when paired with proven strategies:
- Breakout Strategy: Buy above R1, sell below S1; confirm with volume
- Reversal Strategy: Look for bounces at pivot levels; ideal in range-bound markets
- Pivot + Moving Averages: Confirms trend strength
- Pivot + RSI: RSI > 50 + price above pivot → stronger buy signal
- Pivot + Candlestick Patterns: Look for reversal candles near pivots (e.g., bullish engulfing at S1)
- Multi-Timeframe Pivot Strategy: Use daily, weekly, or monthly pivots for confirmation; overlapping levels → strong signals
Bottomline
Pivot points are more than just numbers on a chart—they’re a trader’s compass. Whether you’re trading intraday, swing, or positional, they help you:
- Spot trends quickly
- Identify strong support and resistance levels
- Plan entries, exits, and stop-losses with precision
By combining pivot points with other indicators and trading strategies, you gain a practical edge—trading smarter, not harder. Remember, pivot points guide you—they don’t guarantee results—but used wisely, they make market chaos much more navigable.
Discover the next big investment! Unicorn Signals’ IPO screener helps you identify promising initial public offerings. Download Unicorn Signals and get ahead of the curve! Sign Up Now & Find Your Next IPO Gem!
