 Live
Live
NIFTY ENERGY Weekly Outlook and Analysis:
For the Week: (July 26,2021 – July 30,2021)
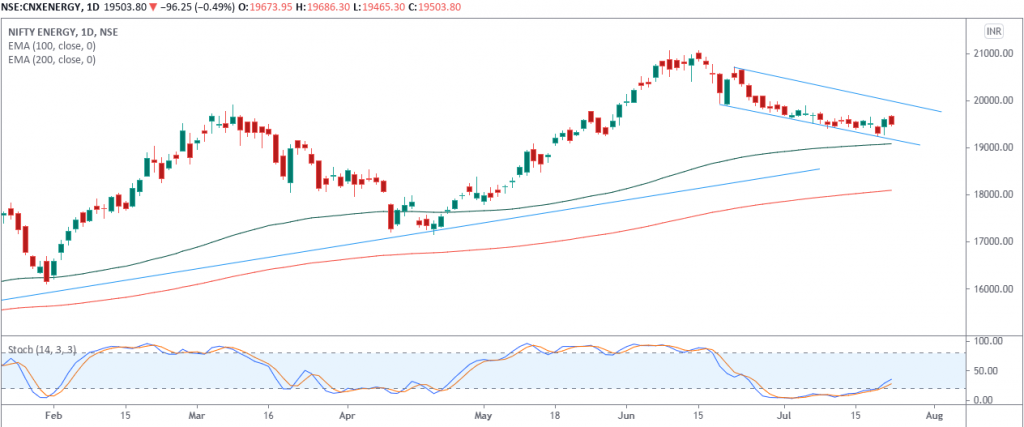
NIFTY ENERGY Index closed the week on negative note losing 64.10 points 0.33%.
Weekly High: 19,686.30
Weekly Low: 19,235.45
Weekly Close: 19,503.80
Weekly Support & Resistance For Nifty Energy Index:
| RESISTANCE 2 | 19,926 |
| RESISTANCE 1 | 19,714 |
| SUPPORT 1 | 19,264 |
| SUPPORT 2 | 19,024 |
Technically on the daily charts we see minor support on the downside for NIFTY ENERGY index lies at 19200 levels, whereas minor resistance on the upside is capped around 19750-19800 levels.
If NIFTY ENERGY index breaches minor support on the downside and closes below it, we may see fresh break down and index can drag towards major support on lower side around 19000 and if breaches minor resistance on the upside and closes above it, we may see fresh breakout and index can head towards higher levels around 20000.
Currently NIFTY ENERGY index is trading above 200 days exponential moving average and suggests long term trend is bullish. EquityPandit’s analyst predicts range for the week is seen from 19100 on downside and 19900 on upside.
