 Live
Live
NIFTY ENERGY Weekly Outlook and Analysis:
For the Week: (March 29,2021 – April 02,2021)
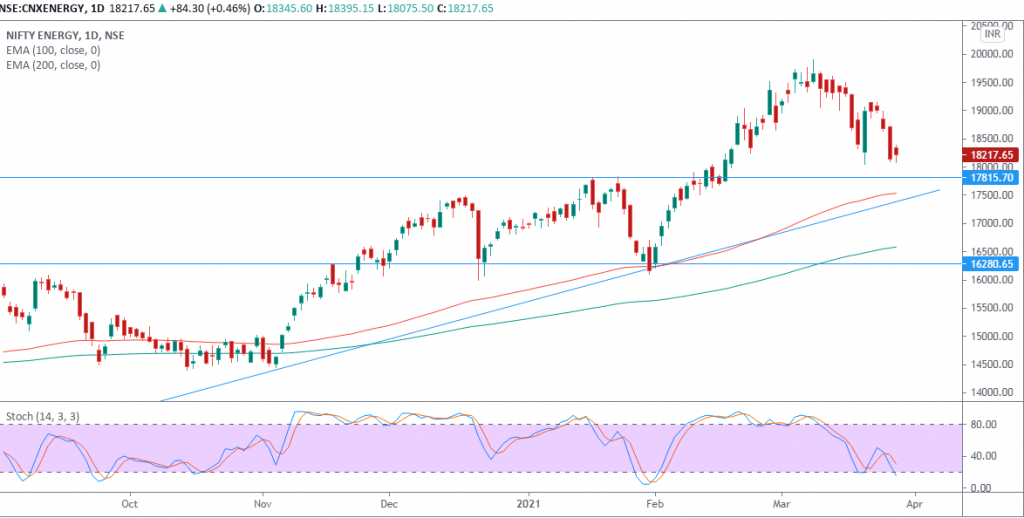
NIFTY ENERGY Index closed the week on negative note losing 767.75 points 4.04%.
Weekly High: 19,152.20
Weekly Low: 18,075.50
Weekly Close: 18,217.65
Weekly Support & Resistance For Nifty Index:
| RESISTANCE 2 | 19,558 |
| RESISTANCE 1 | 18,888 |
| SUPPORT 1 | 17,811 |
| SUPPORT 2 | 17,405 |
NIFTY ENERGY index opened tad higher and witnessed muted gain in early part of the week. Index faced selling pressure in mid weak tracking broader weakness and ended on negative note. We expect index likely to continue its down trend, momentum indicator also trending down.
Technically on the daily charts we see minor support on the downside for NIFTY ENERGY index lies at 17800 levels, whereas minor resistance on the upside is capped around 18600-18650 levels.
If NIFTY ENERGY index breaches minor support on the downside and closes below it, we may see fresh break down and index can drag towards major support on lower side around 17400 and if breaches minor resistance on the upside and closes above it, we may see fresh breakout and index can head towards higher levels around 19100.
Currently NIFTY ENERGY index is trading above 200 days exponential moving average and suggests long term trend is bullish. EquityPandit’s analyst predicts range for the week is seen from 17500 on downside and 19000 on upside.
