 Live
Live
Nifty Realty Weekly Outlook and Analysis:
For the Week: (March 29,2021 – April 02,2021)
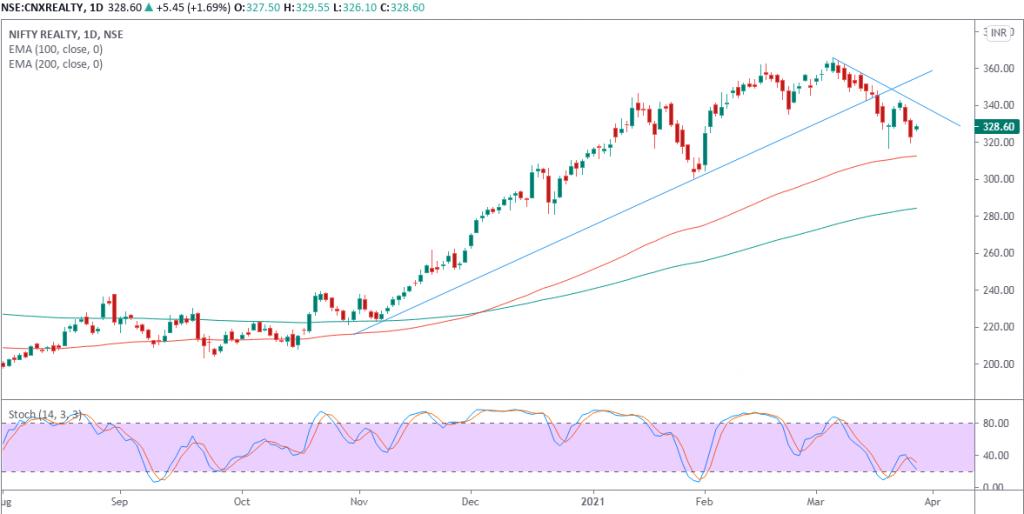
NIFTY REALTY Index closed the week on negative note losing 0.45 points 0.14%.
Weekly High: 342.80
Weekly Low: 319.80
Weekly Close: 328.60
Weekly Support & Resistance For Nifty Realty Index:
| RESISTANCE 2 | 353 |
| RESISTANCE 1 | 341 |
| SUPPORT 1 | 318 |
| SUPPORT 2 | 307 |
NIFTY REALTY index opened flat and rallied in early part of the week. Index witnessed selling pressure in mid week tracking broader weakness. However, index recoup almost all the losses at fag end of the week. Index formed doji candle pattern on weekly charts which suggest indecisiveness of trend. We expect index could see short covering bounce of sideways activity.
Technically on the daily charts we see minor support on the downside for NIFTY REALTY index lies at 319 levels, whereas minor resistance on the upside is capped around 338-340 levels.
If NIFTY REALTY index breaches minor support on the downside and closes below it, we may see fresh break down and index can drag towards major support on lower side around 310 and if breaches minor resistance on the upside and closes above it, we may see fresh breakout and index can head towards higher levels around 350.
Currently NIFTY REALTY index is trading above 200 days exponential moving average and suggests long term trend is bullish. EquityPandit’s analyst predicts range for the week is seen from 312 on downside and 348 on upside.
