 Live
Live
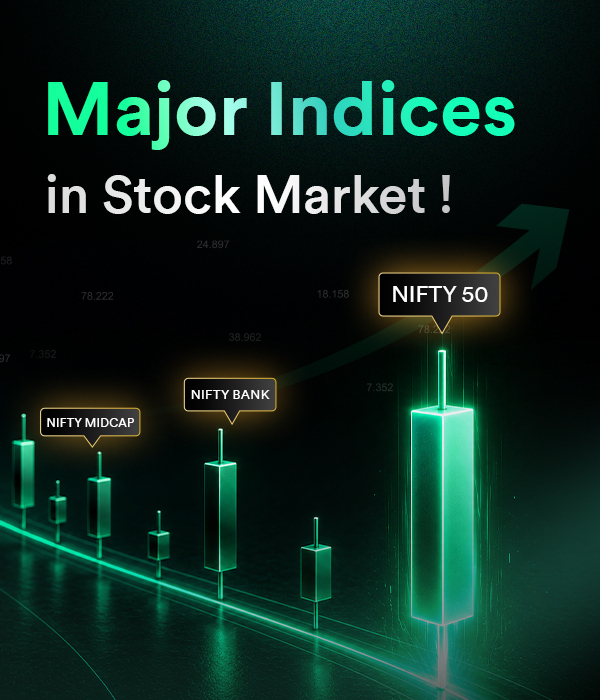
News headlines frequently report that “the market surged” or “the market corrected sharply,” which gives the impression that the entire financial ecosystem is a single, unified entity. In contrast, the stock market consists of thousands of companies that are listed on either NSE or BSE and belong to different sectors, with each one responding in a different manner to economic events, corporate earnings and investor sentiment. This is where stock market indices come to help market participants.
Benchmark indices offer market participants insights regarding the broader market sentiment by monitoring a selected group of listed companies. As these indices are often the first to reflect changes in economic expectations, this optimism or caution then spreads across other indices in a ripple effect. In this blog, we will explore this correlation where one index leads, and others follow.
The purpose of stock market indices
A stock market index is a measure of the performance of a representative basket of stocks. Most broad-market and sectoral indices in India are based on the free-float market capitalisation methodology. In this method, companies with a larger market capitalisation have a greater influence on index movements than companies with smaller market capitalisation. Indices serve several foundational purposes across the financial ecosystem, such as:
- Market barometers: They offer a broader picture of the market direction and health. Additionally, they also reflect sectoral and economic trends.
- Performance benchmarks: They allow investors and mutual fund managers to compare the performance of their portfolios with a benchmark.
- Passive investing anchors: They form the basis for index funds and exchange-traded funds.
- Sentiment indicators: They provide policymakers and market participants with a broad view of investor sentiment.
Rather than predicting future prices, indices help investors understand what the market is collectively communicating.
Why don’t all indices move together?
One of the most common misconceptions among the majority of market participants is that all indices rise and fall simultaneously. But this is not the case, as different industries react to economic growth at vastly different rates. Some of the primary reasons why one index moves ahead of another include:
- Sensitivity to economic events: Certain industries respond instantly to changes in inflation, monetary policy, government spending or global demand. Their indices naturally become early indicators of changing market expectations.
- Institutional investment flows: Institutional investors, whether domestic or foreign, are likely to invest in sectors where they anticipate strong outperformance. Their buying activity usually appears first in larger, more liquid companies before spreading across the market.
- Corporate earnings outlook: Stock prices reflect future expectations rather than historical performance. If investors expect stronger earnings from a particular sector, companies within that industry may begin outperforming well before official results are announced.
For example, the Reserve Bank of India (RBI) decided to change interest rates unexpectedly. This move will have a major impact on the banking and finance industry because it alters borrowing and lending terms. Other industries, like automobiles, real estate, or capital goods, might take weeks or months to reflect the downstream impact of those rate changes, as it doesn’t impact them directly.
Therefore, the indices that comprise the impacted companies are the first to react to these changes, and the rest of the indices follow at a later stage when the change impacts the broader market.
Different indices tell different stories
There are several indices available in the Indian stock market, as one index can’t tell the whole story of every sector. In general, the indices can be classified into two types:
Broad market indices
Broad market indices are composed of companies from diverse industries and provide an overall perspective on market performance. For example, the Nifty 50 and Sensex index is made up of large and liquid companies from different industries; hence, it is one of the most closely tracked indices in the country and a barometer of the overall health of the Indian economy.
This is because the heavyweight constituents of the Nifty 50 account for a significant share of India’s listed market capitalisation, and their performance strongly influences overall market sentiment.
Sectoral indices
Sectoral indices are industry-specific and indicate where the action is concentrated due to specific news, announcements, etc. For example, the Nifty Bank is often the first to respond to domestic liquidity and credit growth.
This makes it one of the primary barometers of the economic health of India. The sectoral indices are the specialised engines of the broader market, providing market participants insights about a specific sector.
Why does market leadership keep changing?
One of the defining characteristics of financial markets is that leadership constantly rotates. The sectors driving today’s rally may not necessarily lead the next one. During periods of rapid economic growth, sectors linked to infrastructure and capital expenditure often receive increased investor attention.
When borrowing costs decline, interest-sensitive industries may benefit. During uncertain periods, investors frequently gravitate towards businesses with stable earnings and resilient cash flows. There are a number of factors that interact to determine which index is dominant at any one time:
- Interest rate movements: Drive capital costs, which have a significant impact on financials and consumer discretionary spending.
- Government policies: Budgets, tax reforms, and production-linked incentive (PLI) schemes heavily direct institutional capital towards favoured sectors.
- Global developments: Geopolitical tensions, global inflation and international tech trends have an immediate impact on domestic tech, pharma and energy indices.
- Business performance: Sustained market leadership depends on business performance. Sectors delivering consistent, surprise earnings growth often attract the most capital.
Recognising these factors helps market participants avoid assuming that yesterday’s winners will continue outperforming indefinitely.
The ripple effect
A strong market rally doesn’t start all at once in every index. In most cases, leadership begins with one or two segments and then expands to the rest of the market. This is called market broadening. For example, if the government is promoting infrastructure spending, engineering and construction indices often respond first.
As the companies operating these sectors are getting constant orders and growing due to the government’s aggressive push, it has a ripple effect on related industries like cement, steel, logistics and industrial manufacturing. A broad-based rally generally displays the following characteristics:
- Leadership begins with a few highly sensitive sectors.
- Trading volumes gradually increase across adjacent industries.
- Market participation widens beyond large-cap companies into the mid-cap space.
- Earnings expectations improve for a larger, more diverse set of businesses.
How to track market breadth?
If one index leads, how do you know if the others are actually following? Professional investors often use market breadth to measure the participation of the followers. This can be monitored by the following metrics:
- Advance-Decline (A/D) ratio: This ratio is the comparison of the number of stocks that closed higher against the number of stocks that closed lower. If the lead index is 1% higher, but the A/D ratio indicates that 70% of all listed stocks decline on that day, then the followers are not following the lead. It indicates that the rally is weak and probably is being led by two or three heavyweight companies.
- 52-Week highs vs. lows: If the leading index is at all-time highs, but very few mid-cap or sectoral stocks are at their 52-week highs, it indicates a lack of broad market participation.
- Above key moving averages: Analysts frequently look at what percentage of stocks within a broad index (like the NSE 500) are trading above their 50-day or 200-day exponential moving averages (EMA). If the headline index reaches an all-time high, but only 40% of the broader market stocks are above their 200-day EMA, it indicates underlying weakness.
Monitoring market breadth is like a lie detector for the stock market. It confirms whether a rally in the leading index is a genuine economic movement or just a deceptive statistical anomaly.
Common mistakes when interpreting indices
Although indices simplify market analysis, market participants should not consider their signals in isolation. Common pitfalls include:
- Assuming uniform performance: Believing that all the stocks within a rising index are performing in the same manner.
- Chasing yesterday’s winners: Assuming that today’s leading sectoral index will continue outperforming indefinitely without a trend reversal.
- Ignoring market breadth: Focusing on only the headline index and not whether mid-caps and small-caps are following the lead or not.
- Emotional reactions: Making drastic portfolio decisions based on daily, short-term index volatility.
The bottom line
Stock market indices are not just numbers that flash on a trading screen; they represent the pulse of the economy, reflecting the collective performance, health, and mood of a group of companies or an entire financial market. There are leaders in each market cycle.
Some indices respond immediately, as the sectors they are based on are hypersensitive to economic changes or global signals. Others follow suit as confidence gradually spreads across industries and company sizes. Monitoring multiple indices, including the headline, sectoral and market-cap specific, and comparing them against market breadth, helps market participants know where the momentum is building.
Understanding that one index leads, and others follow, allows market participants to step back from the day-to-day distractions. In doing so, they will be able to gain a broader perspective on how market cycles play out, allowing them to make investment decisions based on economic reality rather than market hype.