 Live
Live
SBIN Weekly Outlook and Analysis:
For the Week: (June 14,2021 – June 18,2021)
BSE: 500112| NSE: SBIN| ISIN: INE062A01020| SECTOR: BANKS
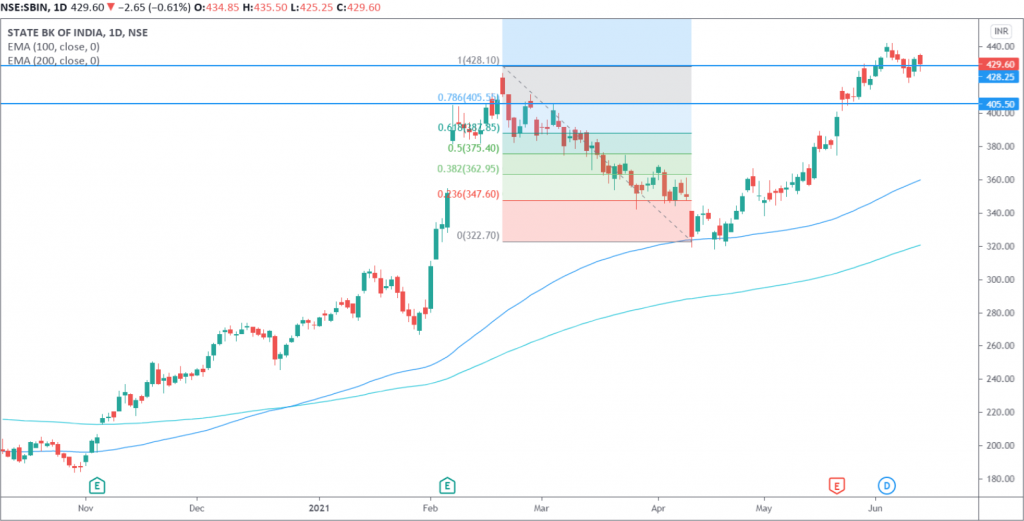
State Bank Of India Share Price : 429.60 (NSE)
SBI closed the Weekly on Negative Note Losing 0.92%
Weekly High: 437.40
Weekly Low: 418.20
Weekly Range: 19.20points
Weekly Support & Resistance For SBIN:
| RESISTANCE 2 | 447 |
| RESISTANCE 1 | 438 |
| SUPPORT 1 | 419 |
| SUPPORT 2 | 409 |
Technically on the daily charts EquityPandit’s Analyst see: Minor support on the downside lies at 419 levels, Minor resistance on the upside is capped around 438 levels.
If stock breaches minor support on the downside and closes below it we may see fresh break down and stock can drag towards Major Support on lower side @ 409 and If stock breaches minor resistance on the upside and closes above it we may see fresh breakout and stock can head towards Major Resistances Level @ 447
Stock is trading above 200 days exponential moving average, suggests long term trend is bullish. EquityPandit’s Predicts Range for the Weekly as 447 on upside and 409 on downside.
The trend for SBIN share prices are managed top close above its important support of 428 levels. A falling window occurred on the candle .The level of 418 would be crucial in the near term as any breach of this level will invite incremental weakness.
