 Live
Live
SBIN Weekly Outlook and Analysis:
For the Week: (March 08,2021 – March 12,2021)
BSE: 500112| NSE: SBIN| ISIN: INE062A01020| SECTOR: BANKS
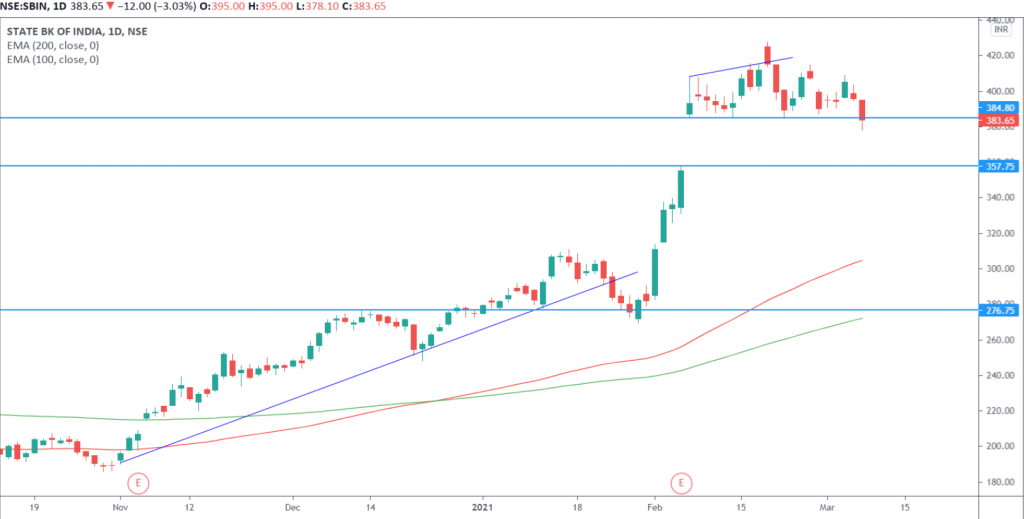
State Bank Of India Share Price : 383.65 (NSE)
SBI closed the Weekly on Negative Note Losing 1.67%
Weekly High: 408.90
Weekly Low: 378.10
Weekly Range: 30.80 points
Weekly Support & Resistance For SBIN:
| RESISTANCE 2 | 420 |
| RESISTANCE 1 | 402 |
| SUPPORT 1 | 372 |
| SUPPORT 2 | 360 |
Technically on the daily charts EquityPandit’s Analyst see: Minor support on the downside lies at 372 levels, Minor resistance on the upside is capped around 402 levels.
If stock breaches minor support on the downside and closes below it we may see fresh break down and stock can drag towards Major Support on lower side @360 and If stock breaches minor resistance on the upside and closes above it we may see fresh breakout and stock can head towards Major Resistances Level @420
Stock is trading above 200 days exponential moving average, suggests long term trend is bullish. EquityPandit’s Predicts Range for the Weekly as 420 on upside and 360 on downside.
On daily chart STATE BANK OF INDIA share price closed below its important support of 385 level in last trading session. Now stock has placed at crucial point where it can move towards downside to fill the gap or can reverse from the same level.
