 Live
Live
SBIN Weekly Outlook and Analysis:
For the Week: (March 29,2021 – April 02,2021)
BSE: 500112| NSE: SBIN| ISIN: INE062A01020| SECTOR: BANKS
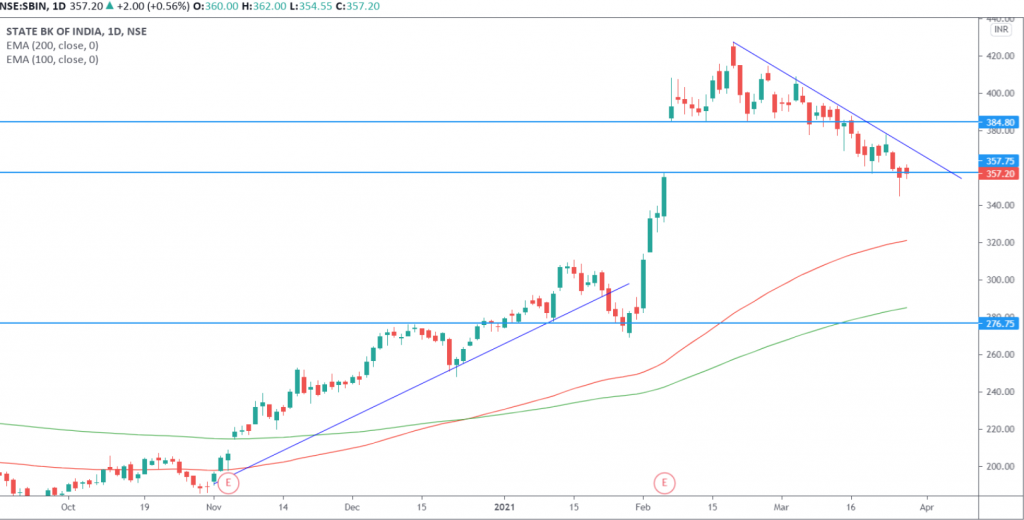
State Bank Of India Share Price : 357.20 (NSE)
SBI closed the Weekly on Negative Note Losing 3.76%
Weekly High: 377.95
Weekly Low: 345.20
Weekly Range: 32.75 points
Weekly Support & Resistance For SBIN:
| RESISTANCE 2 | 391 |
| RESISTANCE 1 | 374 |
| SUPPORT 1 | 342 |
| SUPPORT 2 | 327 |
Technically on the daily charts EquityPandit’s Analyst see: Minor support on the downside lies at 342 levels, Minor resistance on the upside is capped around 374 levels.
If stock breaches minor support on the downside and closes below it we may see fresh break down and stock can drag towards Major Support on lower side @327and If stock breaches minor resistance on the upside and closes above it we may see fresh breakout and stock can head towards Major Resistances Level @ 391
Stock is trading above 200 days exponential moving average, suggests long term trend is bullish. EquityPandit’s Predicts Range for the Weekly as 391 on upside and 327 on downside.
On the daily chart we can see last week was secularly bearish for the stock, the SBIN took a deep cut, and it extended its corrective move. The level of 345 would be crucial support in the near term. No significant formation was noticed on the Candles.
