 Live
Live
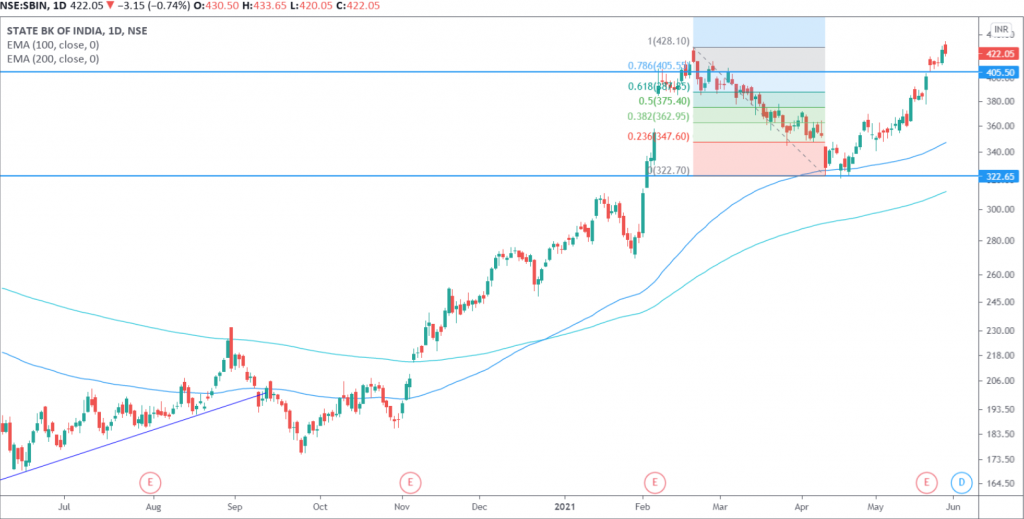
SBIN Weekly Outlook and Analysis:
For the Week: (May 31,2021 – June 04,2021)
BSE: 500112| NSE: SBIN| ISIN: INE062A01020| SECTOR: BANKS
State Bank Of India Share Price : 422.05 (NSE)
SBI closed the Weekly on Positive Note Gaining 5.20%
Weekly High: 433.65
Weekly Low: 405.30
Weekly Range: 28.35 points
Weekly Support & Resistance For SBIN:
| RESISTANCE 2 | 448 |
| RESISTANCE 1 | 435 |
| SUPPORT 1 | 407 |
| SUPPORT 2 | 392 |
Technically on the daily charts EquityPandit’s Analyst see: Minor support on the downside lies at 407 levels, Minor resistance on the upside is capped around 435 levels.
If stock breaches minor support on the downside and closes below it we may see fresh break down and stock can drag towards Major Support on lower side @392 and If stock breaches minor resistance on the upside and closes above it we may see fresh breakout and stock can head towards Major Resistances Level @ 448
Stock is trading above 200 days exponential moving average, suggests long term trend is bullish. EquityPandit’s Predicts Range for the Weekly as 448 on upside and 392 on downside.
The trend for SBIN share price is clearly bullish .Use dips as buying opportunity for a move towards 450 levels. Price can take support near 405-406 levels.
