 Live
Live
SBIN Weekly Outlook and Analysis:
For the Week: (May 3 ,2021 – May 7,2021)
BSE: 500112| NSE: SBIN| ISIN: INE062A01020| SECTOR: BANKS
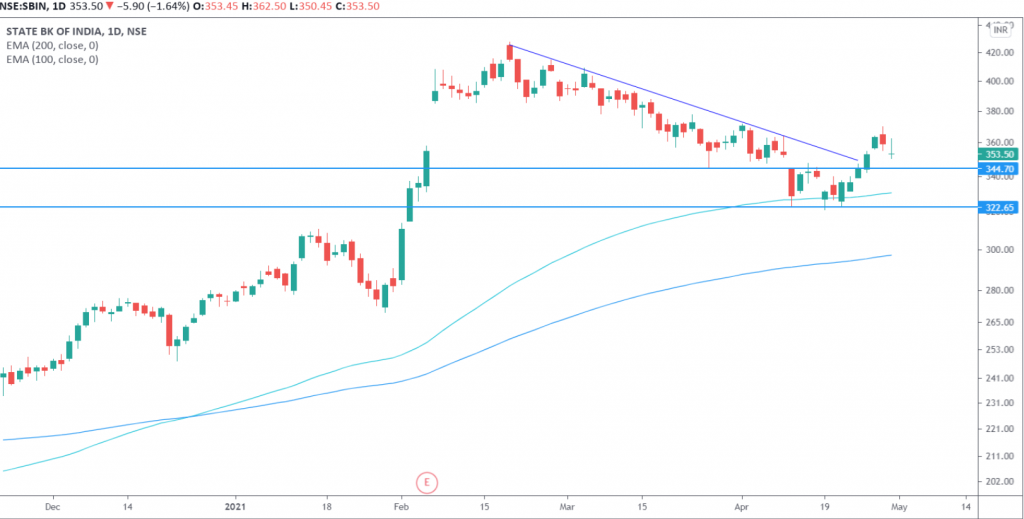
State Bank Of India Share Price : 353.50 (NSE)
SBI closed the Weekly on Positive Note Gaining 5.07%
Weekly High: 369.95
Weekly Low: 339.25
Weekly Range: 30.70 points
Weekly Support & Resistance For SBIN:
| RESISTANCE 2 | 384 |
| RESISTANCE 1 | 368 |
| SUPPORT 1 | 338 |
| SUPPORT 2 | 324 |
Technically on the daily charts EquityPandit’s Analyst see: Minor support on the downside lies at 338 levels, Minor resistance on the upside is capped around 368 levels.
If stock breaches minor support on the downside and closes below it we may see fresh break down and stock can drag towards Major Support on lower side @324 and If stock breaches minor resistance on the upside and closes above it we may see fresh breakout and stock can head towards Major Resistances Level @ 384.
Stock is trading above 200 days exponential moving average, suggests long term trend is bullish. EquityPandit’s Predicts Range for the Weekly as 384 on upside and 324 on downside.
On the daily chart we can see that stock had finally given breakout over its consolidation phase in last week. Stock seems to be side-ways to positive. A break above 370 can take price towards 390 or higher levels. On the lower side, the 100 EMA is one of the most important support for the immediate near term.
