 Live
Live

For technical trend traders, stock breakouts are crucial for identifying potential price action. However, how do they operate, and how can you spot breakthrough stocks?
What Does a Stock Market Breakout Mean?
Some active investors may build their whole trading strategy around a breakout in the stock market or a particular share. When a company or stock index rises through a level of support and resistance that it has previously struggled to move above or below, this is referred as a breakout. Developing the ability to spot and trade potential breakout stocks gives investors another tool to employ to make money in a sometimes-turbulent market. Price charts, in particular candlestick charts used to read price action, are used to display breakout stocks.
The Significance of Stock Breakouts
Traders use breakouts and active investors to spot trends in their early stages. They are a great place to identify profitable chances because they are frequently followed by price movement and increased volatility.The underlying premise of breakouts is simple. Investors won’t want to buy a stock if it repeatedly reaches Rs100 but always retraces since they know they won’t get a return.
However, if the price rises above $100, some investors may view this as a signal to buy, and anyone holding a short position in the stock may close it to reduce their loss. The stock’s price may increase due to the enormous demand, which may also usher in a long-lasting new trend.
Breakout Stock Trading: The Fundamentals
When trading stock breakouts, you must:
- Identifying an opportunity
- Starting your business
- Prepare your exit
Here is an Overview of Each of the Three
The Best Way to Spot Breakout Stocks
You must first locate a market with a clearly defined support or resistance area if you want to spot breakout stocks. As we’ve already seen, the more a stock has risen over this level, the better. Consolidation occurs when a market is confined to a channel between two distinct levels of support and resistance. A breakout may be imminent if one of several patterns within a consolidation is present, such as the head and shoulders, triangles, or flags.
Taking Up a Role
It’s necessary to plan for when to open your position if you are certain that a breakout is imminent.At this point, it pays to be cautious of ‘fakeouts.’ A fake-out is when a market surges past a level of support or resistance before turning back.
In most cases, exercising patience will help you avoid being surprised by a fake-out. Hold off and wait to see if the trend persists rather than opening a position as soon as stock reaches a new level.
The increased volume may indicate that the breakout is genuine. As an alternative, some traders will hold off until the end of the trading session.
Prepare Your Exit
Trading breakout stocks necessitates risk management, just like any other approach. As a result, you must determine when to:
- Profit from a winning position.
- In the event a trend doesn’t materialise, cut your losses.
Using recent price activity, setting a reasonable aim for your trade can be helpful. The extent of a stock’s breakout will frequently depend on the previous channel or pattern’s range. For instance, a range between 100 and 200 might produce a motion that peaks at about 300.
When a stock doesn’t break out, using a stop order at or close to the previous level of support or resistance might stop running losses. Past support levels should turn into new regions of resistance after a good breakout, and previous resistance levels should turn into last support levels.
Signals For Stock Breakout
Once you’ve identified the stocks that are breakout candidates, you need to search for a definitive movement—whether it’s the candlestick or price bar where the breakout takes place—that must convincingly pass through the breakout area. It is less effective than a stock that soared and completed the period well above the breakout point if it moves just above and the candle closes below it. A strong breakout has a higher likelihood of continuing in the desired breakout direction.
Think about the Rs50 index illustration; on a lengthy candle that closed close to the period’s high, the price solidly crossed above the trendline. The old area held even though the index rechallenged the breakout area.
If the breakout area holds on re-tests, it is another evidence of a successful breakout. It is not a favourable indicator, and traders might want to try to quit the trade if the price immediately breaks through the resistance level. A trend reversal in the other direction is more likely if no encouraging signals exist.
Patterns for Stock Breakout
Supply and demand in the stock market influence price movement, and when a breakout signal appears, it typically indicates that buyers were successful in driving the company’s price above the resistance level. Sellers have driven the price below support in a stock that has seen a downward or negative breakout. While not all breakouts result in significant price changes, every significant price change will include several breakouts, usually beginning with an initial breakout.
If traders want to identify these potential stock breakouts early in the process, they should be aware of patterns for their investment analysis. Here are a few illustrations of how to spot breakthrough stocks.
Breakout Stocks for cups and Handles
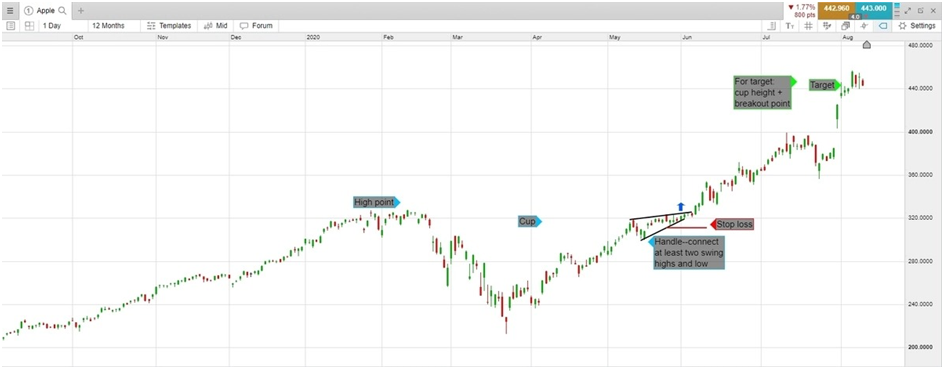
Common chart pattern formation for both individual stocks and stock indexes is the cup and handle pattern. It happens when a price drops from a high position before slowly rising back to it. A 52-week high or any other high point that stands out on the chart can be used instead of an all-time high. That creates the cup.
If the price swings begin to get smaller and smaller whenever the share price is close to the previous high, this indicates that the size of the price movement is decreasing.
Using the drawing tools on our cutting-edge online trading platform, you may draw trendlines on the swing highs and lows of these price swings to see the handle of the cup. Traders may buy when the price rises over the cup’s upper trendline.
You can set a stop-loss below the handle, and by adding the approximate height of the cup to the handle breakout point, you may calculate the target to get out at. The entrance is close to rs325 in the case of the Apple chart sample below. We can determine through an analysis of the cup that it is roughly 110 rupees tall. This results in a target of rs435 when added to the breakout point.
Bollinger Band breakout Stock
To help find breakout stocks, you can also employ Bollinger Bands, a technical indicator for trading methods. Bollinger Bands produce an encircling band around the price on a candlestick chart as it moves. The bands are positioned from the adjustable 20-period moving average by a predetermined number of standard deviations. The price will frequently remain between the ranges.
Keep an eye out for the bands to appear narrow and shift to the side. The bands will be far apart when the price is moving quickly. The bands will narrow as the price moves gradually. Larger price moves and a subsequently occurring breakthrough frequently occur during quiet periods. Alibaba shares displayed a similar pattern, as shown in the stock chart below, before doubling in value over the following year. Take note of how the bands have shrunk from their previous breadth. A probable breakout will be indicated by a breakout above the Bollinger Band.
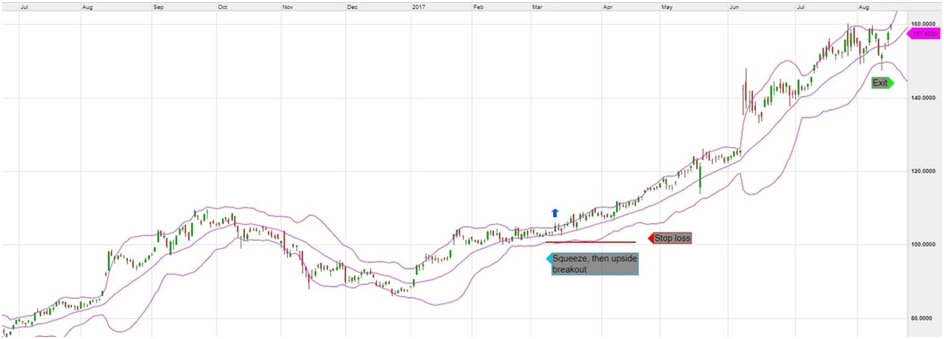
After entry, a stop-loss order is typically set at the lower Bollinger Band. Raising the stop loss and the lower Bollinger Band is feasible as the price rises. This would have held the trader in until the price reached the lower band at Rs 150 with an entry near Rs 105.
