 Live
Live

In the previous session, the market witnessed volatility throughout the day. The Nifty index opened on a slight negative note. Later, we have seen some recovery from day’s low. In the second half of the market, the index made a new high near 16628 and closed with a net gain of 51 points. However, The Bank Nifty has continued to be a major dawdler in the ongoing market rally. Technically, the Nifty index formed a bullish candle with a small lower wick on the chart which indicates that ‘Buy on dip’ strategy will be the preferred strategy for the coming session.
Look at the below research report of ‘Stocks to Buy for – Wednesday, August 18, 2021’ before the market opens.
Bata India Ltd
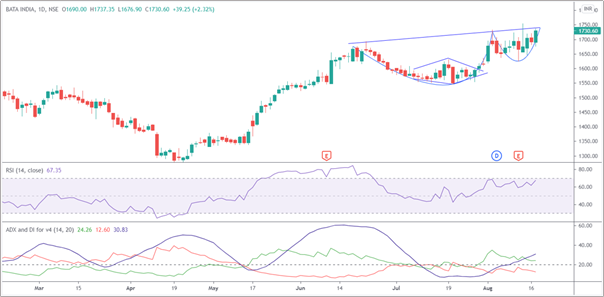
NSE :BATAINDIA BSE :500043 Sector : Leather
On the daily chart, we can see that BATAINDIA stock prices have formed a ‘Cup and Handle pattern’ and are currently placed near the Neckline resistance of handle. It is a continuation pattern which is formed when there is a prior uptrend, followed by a consolidation zone. As per pattern theory, 158 points movement on upside can be expected in coming days.
Previously, we published our report about BATAINDIA on 28th July 2021. The stock has outperformed as predicted and achieved targets of 1640/1700 levels. Now stock is once again ready to take another ride.
We have shown an ADX indicator which indicates a potential in stock. As seen on the chart, +DI is above –DI and ADX value is 30 which shows strength in the trend. The Band Bollinger indicator is acting very well in stock.
BATAINDIA is moving in sync with our expectations. Stock looks to be at a crucial juncture but with bullish up move expecting. we need to wait for positive price confirmation above the neckline of the pattern. Break above the previous day’s high could take prices towards 1895 levels. This outlook is valid as long as we do not see any closing below middle Band Bollinger.
Check More Analysis on BATAINDIA at: Bata India Ltd
Emami Ltd
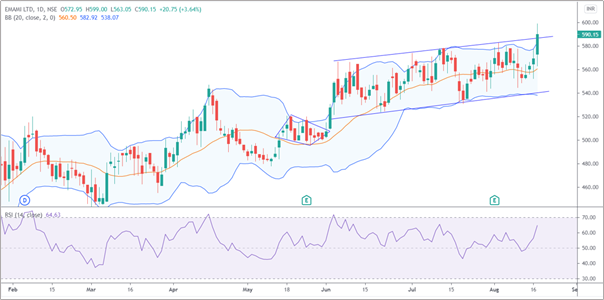
In the daily time frame, EMAMI Ltd share prices are moving in a well channelized manner. In the last session, stock has given a breakout from the upper channel line on the chart. Also, formed a strong bullish candle on the chart and closed with a net gain of 3.64%. The up move has been supported by Band Bollinger.
In short, the outlook for Emami Ltd will remain positive. Now further breaking above its previous day’s closing level might push the prices towards 607/654 levels on upside. This outlook is valid as long as we do not see any closing below 570 supports.
Check More Analysis on EMAMI at: Emami Ltd
