 Live
Live
Check TCS Full Analysis At Unicorn Signals
TCS Weekly Outlook and Analysis:
For the Week: (Mar 20, 2023 – March 24, 2023)
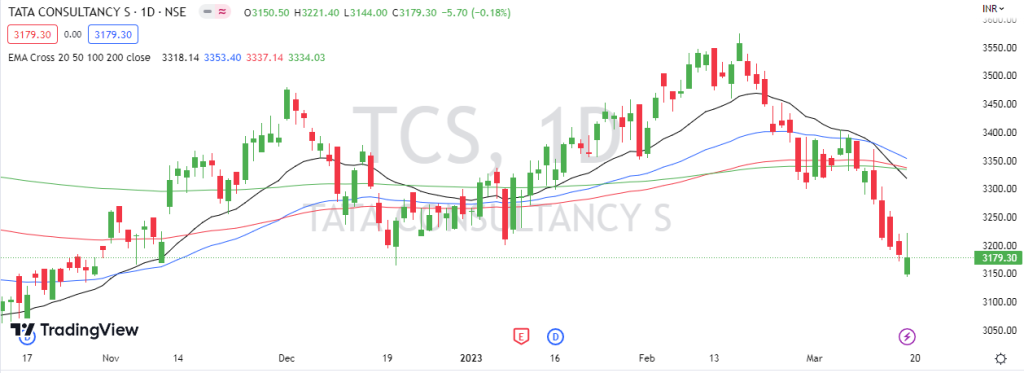
BSE: 532540| NSE: TCS | ISIN: INE467A01029 | SECTOR: I.T
Tata Consultancy Services closed the Weekly on negative Note loosing 4.55%
TCS Share Price: 3179.30
Weekly High: 3369.80
Weekly Low: 3144.00
Weekly Range: 151.70 Points
Weekly Support & Resistance For TCS:
| RESISTANCE 2 | 3455 |
| RESISTANCE 1 | 3317 |
| SUPPORT 1 | 3092 |
| SUPPORT 2 | 3005 |
Technically on the daily charts EquityPandit’s Analyst see: Minor support on the downside lies at 3092 levels, Minor resistance on the upside is capped around 3317 levels.
If stock breaches minor support on the downside and closes below it we may see fresh break down and stock can drag towards Major Support on lower side @ 3005 and If stock breaches minor resistance on the upside and closes above it we may see fresh breakout and stock can head towards Major Resistances Level @ 3455
Stock is trading below 200 days exponential moving average, suggests long term trend is bearish. EquityPandit predicts range for the Weekly as 3455 on upside and 3005 on downside.
