 Live
Live
TCS Weekly Outlook and Analysis:
For the Week: (May 10,2021 – May 14,2021)
BSE: 532540| NSE: TCS | ISIN: INE467A01029 | SECTOR: I.T
Tata Consultancy Services closed the Weekly on a positive note gaining +3.20%
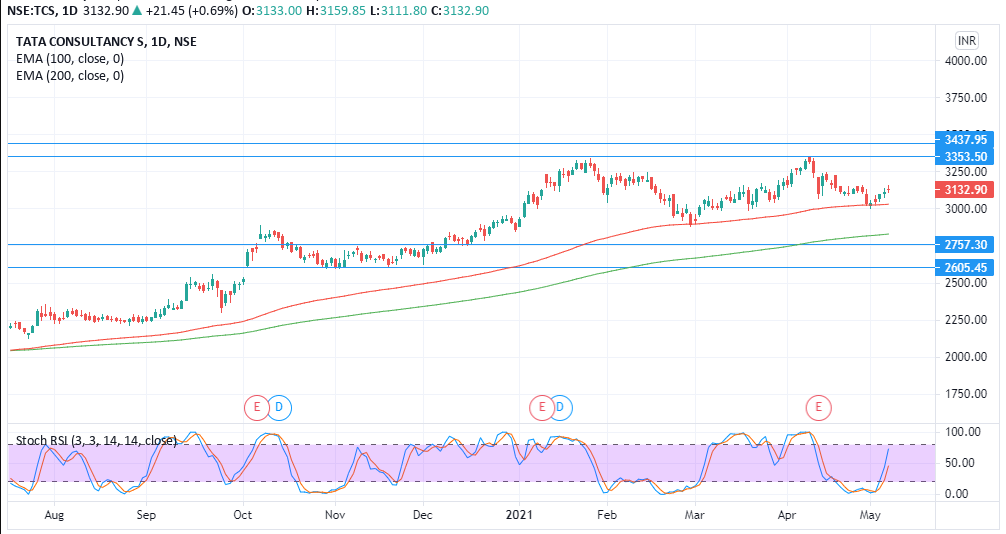
TCS Share Price: 3132.90 (NSE)
Weekly High: 3159.85
Weekly Low: 3004.00
Weekly Range: 155.85 Points
Weekly Support & Resistance For TCS:
| RESISTANCE 2 | 3440 |
| RESISTANCE 1 | 3355 |
| SUPPORT 1 | 2757 |
| SUPPORT 2 | 2605 |
Technically on the daily charts, EquityPandit’s Analyst sees: Minor support on the downside lies at 2757 levels, Minor resistance on the upside is capped around 3355 levels.
If stock breaches minor support on the downside and closes below it we may see a fresh break down and stock can drag towards Major Support on the lower side @ 2605 and If stock breaches minor resistance on the upside and closes above it we may see a fresh breakout and stock can head towards Major Resistances Level @ 3440.
Stock is trading above 200 days exponential moving average, which suggests the long term trend is bullish. EquityPandit predicts the range for the Weekly as 3500 on the upside and 2600 on the downside.
On TCS, stock coming up and making new high with good, now the stock has positive strength and volume. A positive upward trend gives the stock to achieve new lifetime high picks.
