 Live
Live
Introduction and Meaning of Option Chain
Options are contracts that give the bearer the right, but not the obligation, to either buy (call option) or sell (put option) an amount of some underlying asset at a predetermined price at or before the contract expires.
Options trading allows traders to gain from a change in the stock price without paying the purchase price in full; only a premium is paid. Therefore, it is a type of trading that provides the flexibility of not purchasing securities at a certain price for some time.
Option chain can be defined as the listing of all option contracts. It comes with two different sections – call and put.
A call option means a contract that gives you the right but does not give you the obligation to buy an underlying asset at a particular price and within the option’s expiration date.
On the other hand, a put option means a contract that gives you the right but does not give you the obligation to sell an underlying asset at a particular price and within the option’s expiration date.
Options are contracts that give the bearer the right, but not the obligation, to either buy (call option) or sell (put option) an amount of some underlying asset at a predetermined price at or before the contract expires.
Options trading allows traders to gain from a change in the stock price without paying the purchase price in full; only a premium is paid. Therefore, it is a type of trading that provides the flexibility of not purchasing securities at a certain price for some time.
An option chain lists all option contracts, including put and call options, for a given security. However, several traders focus on the net change,’ ‘bid,’ ‘last price,’ and ‘ask’ columns to assess current market conditions.
The option chain is also called the option matrix. With the help of the option matrix, several skilled traders can easily see the direction of price movements.
Option Matrix also allows users to analyse and identify the points at which a low or high level of liquidity appears. Typically, it limits traders’ ability to evaluate specific strikes’ depth and liquidity.
Here are components of the options chain that will help you to read the options easily. Let’s look at the given below:
1. Strike Price
Strike price means the price at which both buyers and sellers of an Option agree to execute a contract. The exchange decides the number of strike prices available in every option contract.
2. In-The-Money or ITM
In-the-Money ATM is considered when the call option’s strike price is lower than the current market price.
Conversely, the put option is In-The-Money ATM if the Strike Price exceeds the current market price.
3. At-The-Money or ATM
At-The-Money or ATM defines a situation wherein the strike price of a put or a call option is equivalent to the current market price of an underlying asset.
4. Out-The-Money or OTM
The out-the-money call option is considered when the strike price is higher than the current market price of an underlying asset.
Similarly, on the other hand, if the strike price is lower than the current market price of an underlying asset, then the put option is said to be at OTM.
5. Open Interest or OI
Open interest (OI) in options refers to the total number of outstanding or open contracts for a particular option contract. Traders and analysts closely monitor open interest because it reflects the liquidity and activity level of a particular options contract. Higher open interest generally indicates greater liquidity, which typically translates to narrower bid-ask spreads and better trade execution.
6. Change in Open Interest
The change in open interest refers to the net increase or decrease in the total number of outstanding or open contracts for a particular options contract over a specified period, usually from one trading session to another. Monitoring changes in open interest can help traders gauge market sentiment, assess the strength of trends, and identify potential trading opportunities.
7. Volume
Volume refers to the total number of option contracts traded during a specified period, typically a trading session. It’s a fundamental indicator of market activity and liquidity, providing insights into the level of interest and participation in a particular option contract or strike price.
8. Implied Volatility or IV
IV measures the anticipated magnitude of price changes in the underlying security over a specific period, as implied by the prices of options on that security. It’s derived from options prices using an options pricing model, such as the Black-Scholes model or more advanced models, like the Binomial model. Implied volatility reflects the collective expectations and sentiments of market participants regarding the future price movements of the underlying asset.
9. Bid Price
Bid Price means the actual value quoted within the last buy order. A price above the Last Traded Price (LTP) may indicate rising demand for options.
10. Bid Quantity
Bid Quantity is the total number of open buy orders for a particular strike price. It tells you about the current demand for an option’s strike price.
11. Ask Quantity
Ask Quantity is the total number of open sell orders for a particular strike price. It indicates the availability of the options.
12. Ask Price
Ask Price is the value quote within the last sell order.
13. Last Traded Price (LTP)
The last traded price is the price at which the previous transaction occurs between a buyer and seller.
Whereas, the closing price is the average of all the transactions that took place for a stock in the last half an hour of the market.
How to Read Options Chain and do an Option Chain analysis?
- By providing your stock’s inputs, you can read an Option Chain on the National Stock Exchange (NSE) website in the Equity Derivatives segment.
- However, this blog has covered the steps for reading the Option Chain through the NSE Website. The steps are as follows –
- Go to the NSE website link – https://www.nseindia.com/option-chain. Then, on the same page, go to ‘Equity Stocks’
- Once you open the page for Option Chain (Equity Derivatives), you will find the page below.
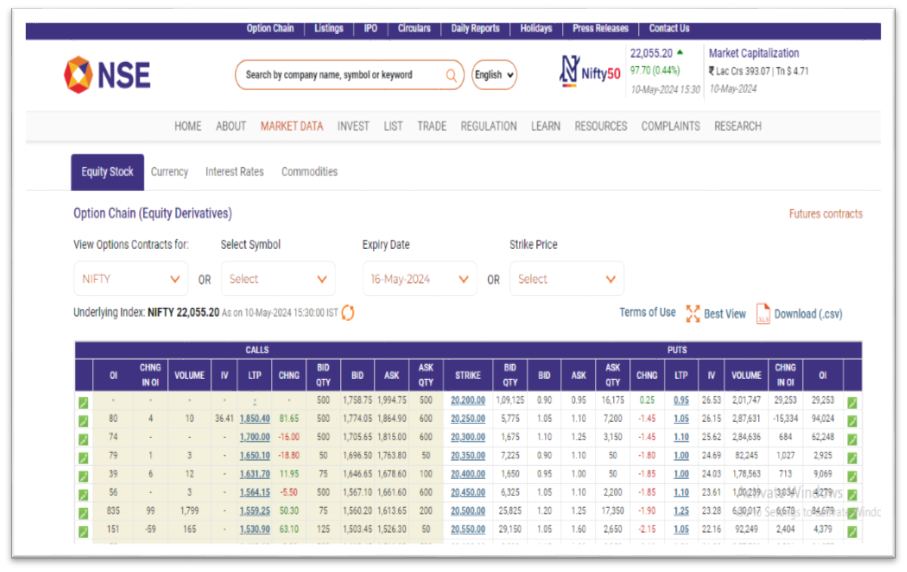
- On this page, go to View Options Contracts for>> NIFTY. Once you select NIFTY, the expiry date will automatically come. Alternatively, if you Select Symbol>> Choose a Script (Stock name), again, the Expiry date will automatically come.
- In our example, we have chosen NIFTY in View Options Contracts, and the expiry date on the website is, by default, 16th May 2024.
- The latest data is fetched as of 10th May 2024, 15:30 IST, when the Underlying Index, NIFTY, has a strike price of INR 22,050.20.
- The middlemost column of the displayed data shows different strike prices for the scrip. On the left side of the Strike prices column, we have the ‘Call Option’ data; on the right side, we have the ‘Put Option’ data.
Interpreting the data in detail
- Open interest is the total number of outstanding contracts traders hold at the end of a trading day. It’s calculated by adding up all contracts that have been purchased or sold but have not yet been offset or expired.
- An increase in open interest indicates that more traders have opened positions for the day than closed them, suggesting that new money is coming into the market. A decrease in open interest means more positions are closing than opening, indicating that money flows out of the market.
- The strike price with the highest OI on the call side will act as a resistance level as writers add short positions on the call side at that strike price and try to keep the prices below the strike price. Call writers or sellers have a bearish or sideways outlook for the market.
- Similarly, the strike price with the highest ‘OI’ on the put side will act as support as writers add short positions on the put side at that strike price and try to keep the prices above the strike price. Put writers or sellers have a bullish or sideways outlook for the market.
- The change in open interest (OI) is the difference between the current day’s open interest and the previous trading session’s open interest. It can be used to identify the market’s short-term direction and approximate support and resistance levels.
- If Implied Volatility (IV) increases, the premium becomes expensive; high IV also means high volatility in LTP and vice versa. On the other hand, if IV decreases, the premium becomes cheaper. The Current Market Price of the premium, also known as the Last Traded Price (LTP), is the premium amount.
- Find the PCR (Put Call Ratio) with the perspective of OI.
= Total Open Interest (Put Side)/ Total Open Interest (Call Side)
PCR>1 bullish, PCR<1 bearish, PCR = 1 i.e. market is uncertain
A high put-call ratio (above 1) indicates a bullish sentiment, suggesting that investors are more inclined towards writing put options, possibly anticipating a market rise. A low put-call ratio (below 1) implies a bearish sentiment, indicating a higher preference for writing call options, possibly anticipating a market rise.
Conclusion
Use online resources and broker platforms that provide option chain data with visualisations for easier analysis.
Remember, option chain analysis is just one piece of the puzzle. Combine it with technical analysis and fundamental analysis for a well-rounded trading strategy.
Understanding options trading involves inherent risks, so it’s crucial to do your research and gain experience before risking capital.
Equitypandit brings you Unicorn | The Super App for Indian Stock Market, where you can find 103+ tools for and 10x your trading and investing journey.
You can get easy access to the platform as it is available on Android, iOS and Web as well.
Try the Option Chain tool to analyze and research like a pro and make smarter Options Trading decisions.
Check out Unicorn Signals Now.
