

Shares of Vedanta fell as much as 27% to 216 level since 16th June and are trading below 52-week low. Here’s Why?
Vedanta Industries issued a surprise advertisement in newspapers in June 2022 inviting EOI (expression of interest) for its closed copper smelter located in Tuticorin, Tamil Nadu. After this news, Vedanta tanked nearly 12 per cent to their fresh 52-week low on 20th June. The large cap share is now trading lower than the 5-day, 20-day, 50-day, 100-day and 200-day moving averages.
Why did the plant shut down?
Sterlite Copper plant is a unit of Vedanta Ltd, operating a 400,000-tonne per annum capacity plant in Tamil Nādu. Sterlite Copper Plant facilities like Copper Refinery, Copper Rod plant, Sulphuric Acid Plant, oxygen generation unit. The plant was shut down in May 2018 by the Tamil Nadu government.
People of Kumarediyapuram have been part of this struggle against Sterlite for the past 23 years. They have lost many of their loved ones to cancer and to other ailments. After their 23-year-long battle, in May 2018 evening, the Tamil Nadu government passed a government order (GO) to shut down the Sterlite copper smelting plant permanently.
In April 2021,Tamil Nadu Chief Minister passed a resolution to allow Vedanta-owned Sterlite Copper to open its copper smelting plant in Thoothukudi to produce oxygen for a four-month period amid surging COVID-19 cases.
Why Is Vedanta Share Price Falling?
Putting an end to its efforts of reopening the Sterlite Copper unit in Thoothukudi, Tamil Nadu, Anil Agarwal-led Vedanta has decided to sell it and has invited expression of interest (EoI) from interested parties. Through a newspaper advertisement published on Monday, the company has invited “financially competent” players to submit EoIs by July 4. The bid was invited in conjunction with Axis Capital. The announcement has come as a surprise. The share lost Rs 33.40 on Monday when the advertisement appeared. During the period under review, the share has fallen from Rs 291.40 to Rs 222.20, a fall of Rs 69.20 or 23.74%.
Technical View on Vedanta Ltd.
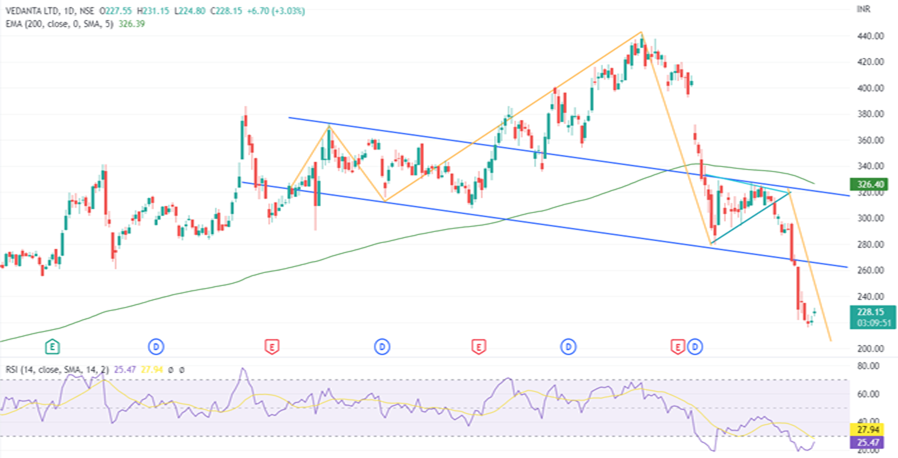
In the daily time frame, Vedanta stock price is moving in the form of a ‘Head & shoulder’ pattern. The right shoulder completed near 279 level. Stock has given a breakout from the neckline of the pattern on 16th June 2022. Prices are moving below the 200 EMA, indicating more weakness in the coming session. In addition, stock prices have formed a Bearish Pennant pattern on the daily chart. The pattern indicates the Downtrend will continue for a short term.
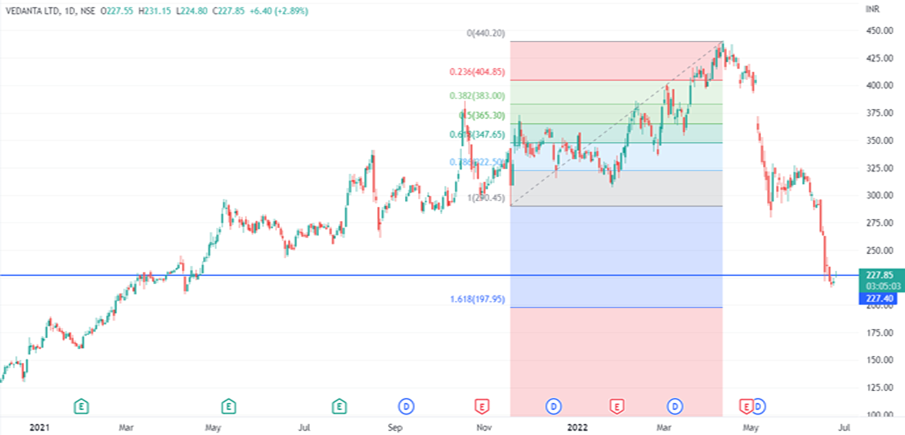
Stock is now quoting near 227-225 level. The overall trend for Vedanta is negative. We have applied Fibonacci Retracement on the chart to determine price action and target. As per projection, price can move towards 197 level on the downside. The other hand, 227 is a very crucial level for the stock. If prices manage to sustain above this level, we can see a pullback rally in the coming session. Stock can move upside towards 250 level. Use Parabolic Sar indicator for entry and exit position.
Check More Analysis on VEDL at: Vedanta Ltd
