 Live
Live
Motherson Sumi Systems Ltd
NSE :MOTHERSUMI BSE :517334 Sector : Auto Ancillaries
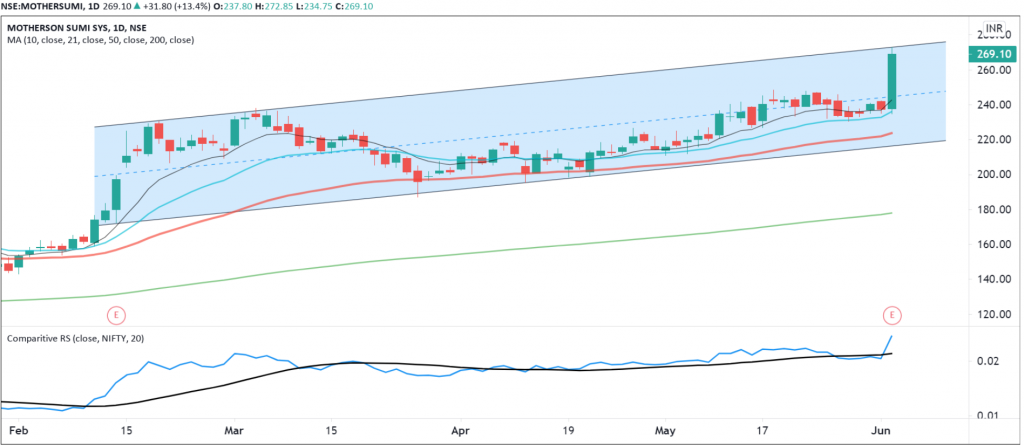
Motherson Sumi Systems Limited on Wednesday 2nd June 2021 stock zoomed up 13.5% on account of stellar performance in FY21 Q4. Stock closes at 269.10 on NSE. It was up Rs.31.8 per share from yesterday’s closing. Company sharply beats analyst estimates. Reported a 289 per cent year-on-year rise in its consolidated net profit to Rs.713.6 crore for the quarter ended March.
What’s Ahead? Technical Outlook of MOTHERSUMI:
Stock is trading in “upwards sloping channel pattern”. As marked in the chart above. Today Hits the resistance level of the upward sloping channel at 272.85 which was Wednesday’s 2nd June intraday high. This level would act as immediate resistance for the stock. In the next few trading sessions we may see some profit booking. Currently stock is trading at make or break levels.
From here 272.85- 274 would act as a resistance zone for the stock. If sustains above 274 we would see stock heading higher. When Fibonacci retrenchment is plotted on weekly charts, targets on upside are 398 (1.618% of Fibonacci level). We could see these level in the next 2-3 months. For swing traders and intraday traders 272.85 would act as immediate resistance and traders are recommended to go short with stop loss placed above 275 for the targets of 250. For Investors we recommend to go long only above 275 levels for targets of 398 with stop loss of 230.

Now Analyze Any Stock Yourself Just In a Few Minutes…
A Free but the Most Powerful Tool For Smarter Analysis of any stock. Analyze any stock at: StockFact – Top Stock Research, Screener And Analysis Tool
