Want a perfect stock portfolio for 2026?
Create Now
Sensex Today
Explore On


Prev. Close
Open price
Today's Low / High
52 Week Low / High
Volume
Bid Price (qty)
Offer Price (qty)
Sensex Chart
Returns
| 06 Feb 83580.40 (0.32%) | 05 Feb 83313.93 (-0.60%) | 04 Feb 83817.69 (0.09%) | 03 Feb 83739.13 (2.54%) | 02 Feb 81666.46 (1.17%) | 01 Feb 80722.94 (-1.88%) | 30 Jan 82269.78 (-0.36%) | 29 Jan 82566.37 (0.27%) | 28 Jan 82344.68 (0.60%) | 27 Jan 81857.48 (0.39%) | 23 Jan 81537.70 (-0.94%) | 22 Jan 82307.37 (0.49%) | 21 Jan 81909.63 (-0.33%) | 20 Jan 82180.47 (-1.28%) | 19 Jan 83246.18 (-0.39%) | 16 Jan 83570.35 (0.23%) | 14 Jan 83382.71 (-0.29%) | 13 Jan 83627.69 (-0.30%) | 12 Jan 83878.17 (0.36%) |
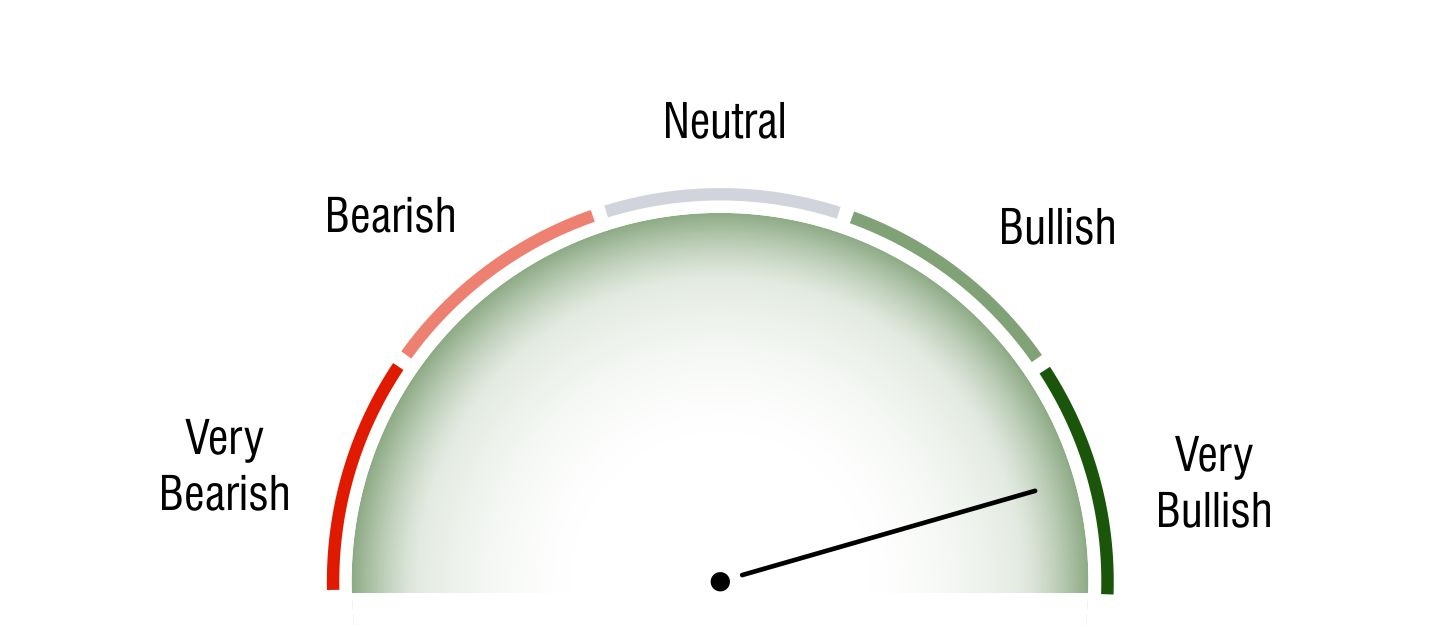
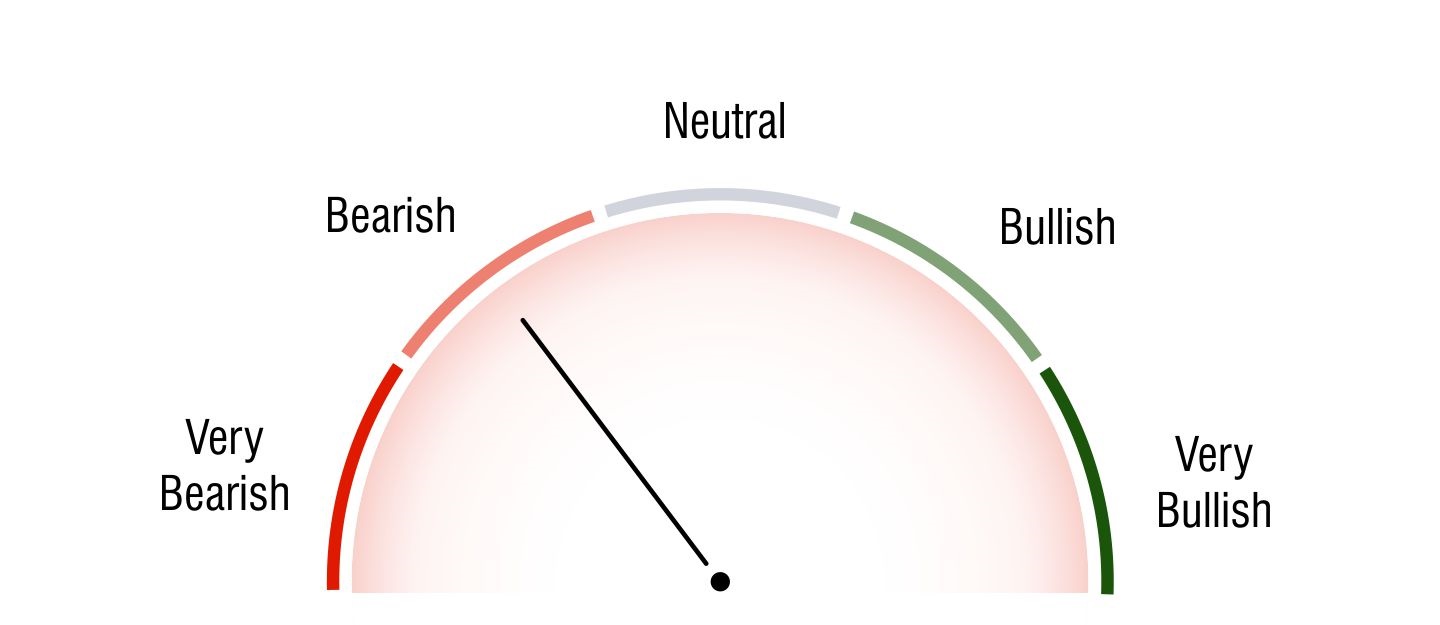
Sensex Bullish / Bearish Zone
Technical Analysis
Short Term Investors

Very Bullish
Medium Term Investors

Bearish
Long Term Investors

Bullish
Moving Averages
5 DMA
Bullish83223.52
10 DMA
Bullish82587.89
20 DMA
Bullish82754.77
50 DMA
Bearish84164.53
100 DMA
Bearish83716.17
200 DMA
Bullish82626.58
Intraday Support and Resistance
(Based on Pivot Points) Updated On Feb 06, 2026 04:00 PM For Next Trading Session| Pivots | Classic | Fibonacci | Camarilla | Woodie | DM |
|---|---|---|---|---|---|
| R3 | 84506.66 | 84059.39 | 83769.26 | - | - |
| R2 | 84059.39 | 83797.04 | 83706.31 | 84111.34 | - |
| R1 | 83819.89 | 83634.97 | 83643.35 | 83923.79 | 83592.71 |
| P | 83372.62 | 83372.62 | 83372.62 | 83424.57 | 83259.03 |
| S1 | 83133.12 | 83110.27 | 83517.45 | 83237.02 | 82905.94 |
| S2 | 82685.85 | 82948.2 | 83454.49 | 82737.8 | - |
| S3 | 82446.35 | 82685.85 | 83391.54 | - | - |
Sensex Stock List
Stuck on a Stock? Get clear short term view in seconds!
Just Ask The Analyst| Company Name | Price | Chg. | Market Cap (Cr) | 52 Week High | 52 Week Low | ROE | P/E | P/B | EBITDA |
|---|

